Handy Linux Debugging Tools
Linux has a treasure trove of utilities that allows you to keep tabs on whats hitting your performance. More on bash later where you can almost automate and create workflows.

I have been spending a lot of times on VM in different cloud environment. Some for work and some for keeping my self up to date. Having to keep my set up as frugal as I can, meant having no access to cool tools or a GUI to check on performance.
Being a Product Manager, I like to keep tabs on performance too as thats one area I work in. Luckily, I spent a lot of time in my early days on Linux and the good part about that is the fact that some of the tools I used back in the day still exists - just better in some cases.
There are some very handy local utilities that you can use to quickly get an idea on how your application that you just deployed kids impacting your CPU.
Most applications - even the ones you build, spend a lot of time on the CPU - like a billion of them and this is normal. However, you would notice that these cycles don’t often last that long. Typically they spike when launched, die down, and then again spike when you are doing some heavy processing. So you always want to keep your eye out for those processes that are consuming these billions of cycles for a longer periods of times (minutes).
Perf is a well known utility and can get you some answers very quickly. Also, this is an old utility, so it has its quirks and weirdness. But you will get over them very quickly cause the plethora of information this one utility can provide is just amazing. The key is to have patience and try to understand the output.
Let’s do a small experiment:
- Run
$ sudo perf record python - After running it for sometime quit by hitting
Ctrl + C - The results are saved in a file called
perf.data - To view the results run
$ sudo perf report
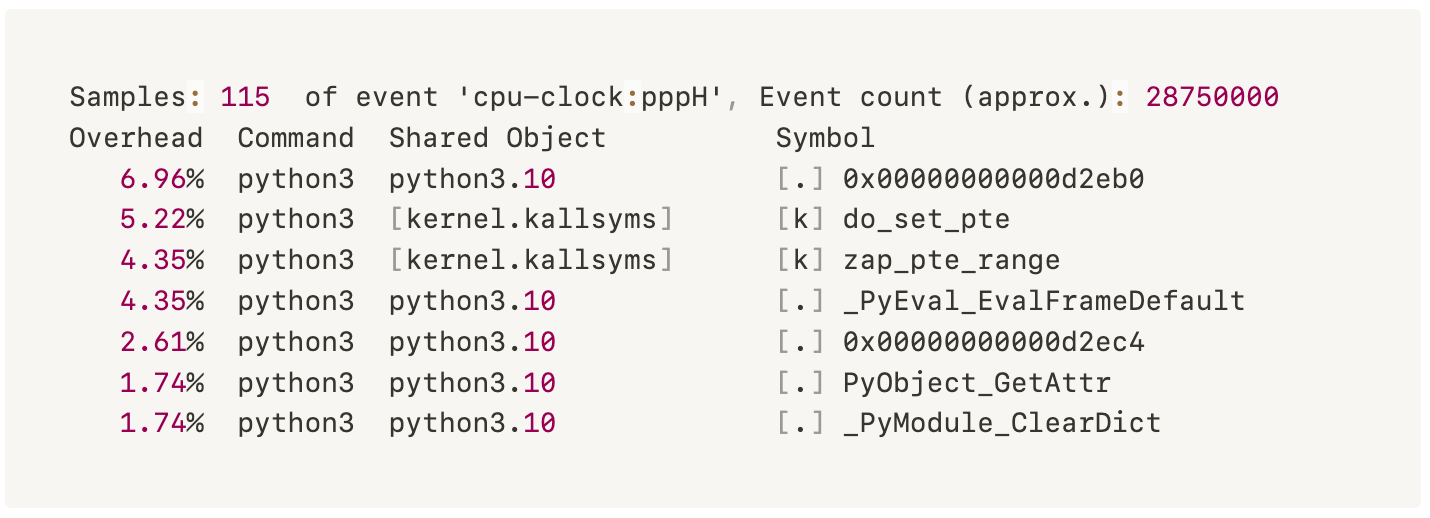
This will show you the C functions from the CPython interpreter (not the Python functions) and its % usage on the CPU.
One other thing that I discovered by accident is combining top with perf. This is useful when you have slowness in your machine and if you suspect CPU is the culprit. I have now starting using these two function for any thing that I build and deploy - considering am not a full time programmer and this will tell me if its my code causing those CPU spikes.
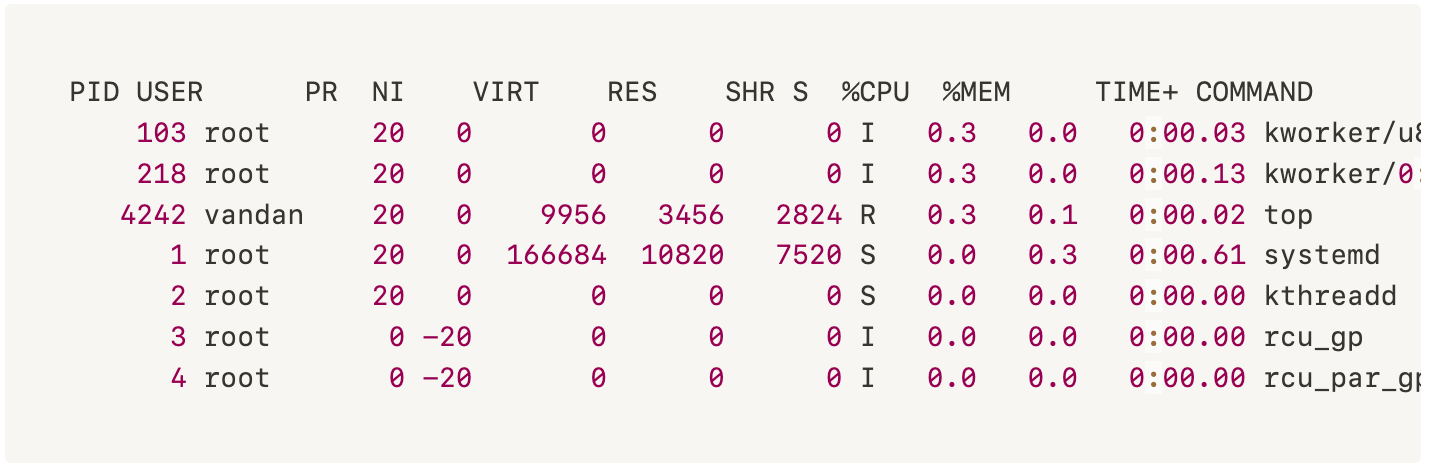
When you run top command; this will show the list of all programs and its % usage of the CPU.
You can then run $ perf top - This is just like top but for functions instead of programs. This will help you determine what function in the program is causing the CPU to spike so much.
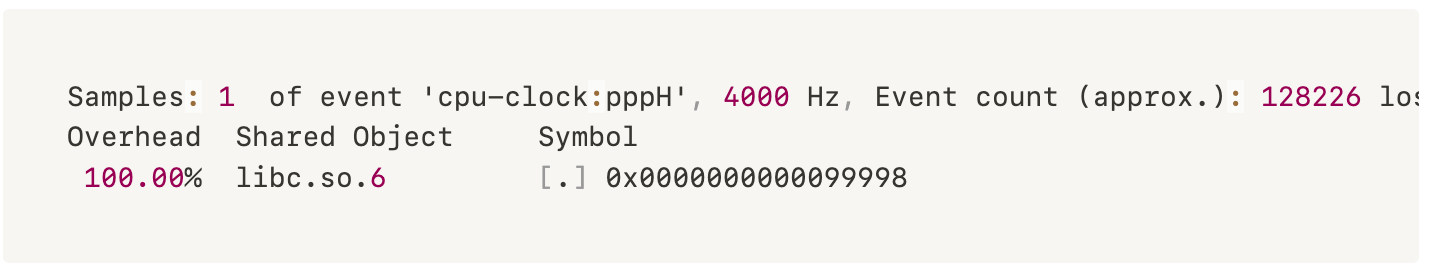
Keep in mind that perf top doesn’t always help but its easy to try and sometimes you are surprised by the results.
CPU Performance
Another cool project to check out is Flamegraphs by Brendan Gregg. Flamegraphs allows you to visualize your CPU performance. Follow the instruction on his GitHub to generate report. The graph is built from collections (usually thousands) of stack traces sampled form a single program.
CPU Cache
Your CPU has a small cache on it called the L1 cache that it can access in about ~0.5 nanoseconds. Its 200x faster than accessing the RAM. If you are trying to do operation where ever 0.001 seconds matter, CPU cache usage matters. But you don’t want anyone to be abusing it.
Run $ perf stat Let it run for a few seconds and then quit by hitting Ctrl + C This will show you if any program is using those cache and how much.
You can also run $perf stat ls which simply runs the ls command and prints a report at the end. You can also pass -eto get specific stats.
Your CPU tracks all kinds of counters and what its doing. $ perf stat asks it to count things (like L1 cache misses) and reports the results.
OSQuery
Another tool that you can use is Facebook’s Osquery. It’s a great tool that uses your well known SQL type commands to get system information. For example SELECT * FORM cpu_time shows all the information about your CPU; however this does not give detailed information like your perf tool.
[
  {"core":"0","guest":"","guest_nice":"","idle":"42719556","iowait":"","irq":"","nice":"0","softirq":"","steal":"","system":"5917032","user":"8672865"},
  {"core":"1","guest":"","guest_nice":"","idle":"43009824","iowait":"","irq":"","nice":"0","softirq":"","steal":"","system":"5611049","user":"8703499"},
  {"core":"2","guest":"","guest_nice":"","idle":"51563142","iowait":"","irq":"","nice":"0","softirq":"","steal":"","system":"1481150","user":"4408155"},
  {"core":"3","guest":"","guest_nice":"","idle":"54418187","iowait":"","irq":"","nice":"0","softirq":"","steal":"","system":"814161","user":"2241062"},
  {"core":"4","guest":"","guest_nice":"","idle":"56364993","iowait":"","irq":"","nice":"0","softirq":"","steal":"","system":"321121","user":"801220"},
  {"core":"5","guest":"","guest_nice":"","idle":"56831839","iowait":"","irq":"","nice":"0","softirq":"","steal":"","system":"194854","user":"466307"},
  {"core":"6","guest":"","guest_nice":"","idle":"57023887","iowait":"","irq":"","nice":"0","softirq":"","steal":"","system":"139560","user":"335357"},
  {"core":"7","guest":"","guest_nice":"","idle":"57229817","iowait":"","irq":"","nice":"0","softirq":"","steal":"","system":"81538","user":"190494"},
  {"core":"8","guest":"","guest_nice":"","idle":"57320358","iowait":"","irq":"","nice":"0","softirq":"","steal":"","system":"53318","user":"129686"},
  {"core":"9","guest":"","guest_nice":"","idle":"57351338","iowait":"","irq":"","nice":"0","softirq":"","steal":"","system":"44850","user":"107732"}
]
There are other tools that your engineering team uses with can give you a whole new insight on performance of your application. Chances are they are already setup with an APM. or if you are feeling a little adventurous take a look at Google Puppeteer.