Peek into your favorite AI Chatbot’s User Experience
Armed with nothing but Chrome's DevTools, you can now peek behind the curtain of your favorite AI Cahtbot and see exactly what's happening.
Ever wondered how fast your AI chatbot really is? How it streams responses? For an enterprise, it’s about ensuring they effectively serve their intended purpose, deliver tangible business value, maintain user trust, and contribute positively to the overall digital experience for both customers and employees.
Without robust monitoring, an enterprise is operating its AI chatbot initiative blindly, risking inefficiencies, user dissatisfaction and wasted investment.
To track any kind of performance/user experience monitoring one needs to understand how these chatbots work. Modern AI chatbots don't send you the entire response at once. They stream it; i.e. sending small chunks as they generate them. This creates that satisfying "typing" effect.
I started using ChatGPT and eventually transitioned to Claude or Google Gemini depending on my use case. And there is no surprise that different chatbots use different mechanisms to stream data.
- Server-Sent Events (SSE) - Used by Claude, ChatGPT, Perplexity
- XHR Streaming - Used by Google Gemini
- WebSocket - Used by Microsoft Copilot
Let’s take a look behind the scenes on how these work. On any of your chromium browser, open up your Developer Tools and navigate to the “Network” tab.
I’m using Claude.ai for this example. Now, click the clear icon to start fresh. Once cleared, go to your UI and send a message “Count to 10”
In your DevTools, Network Tab:
1. Look for a request containing "completion"
2. Click on it
3. Go to "Timing" tab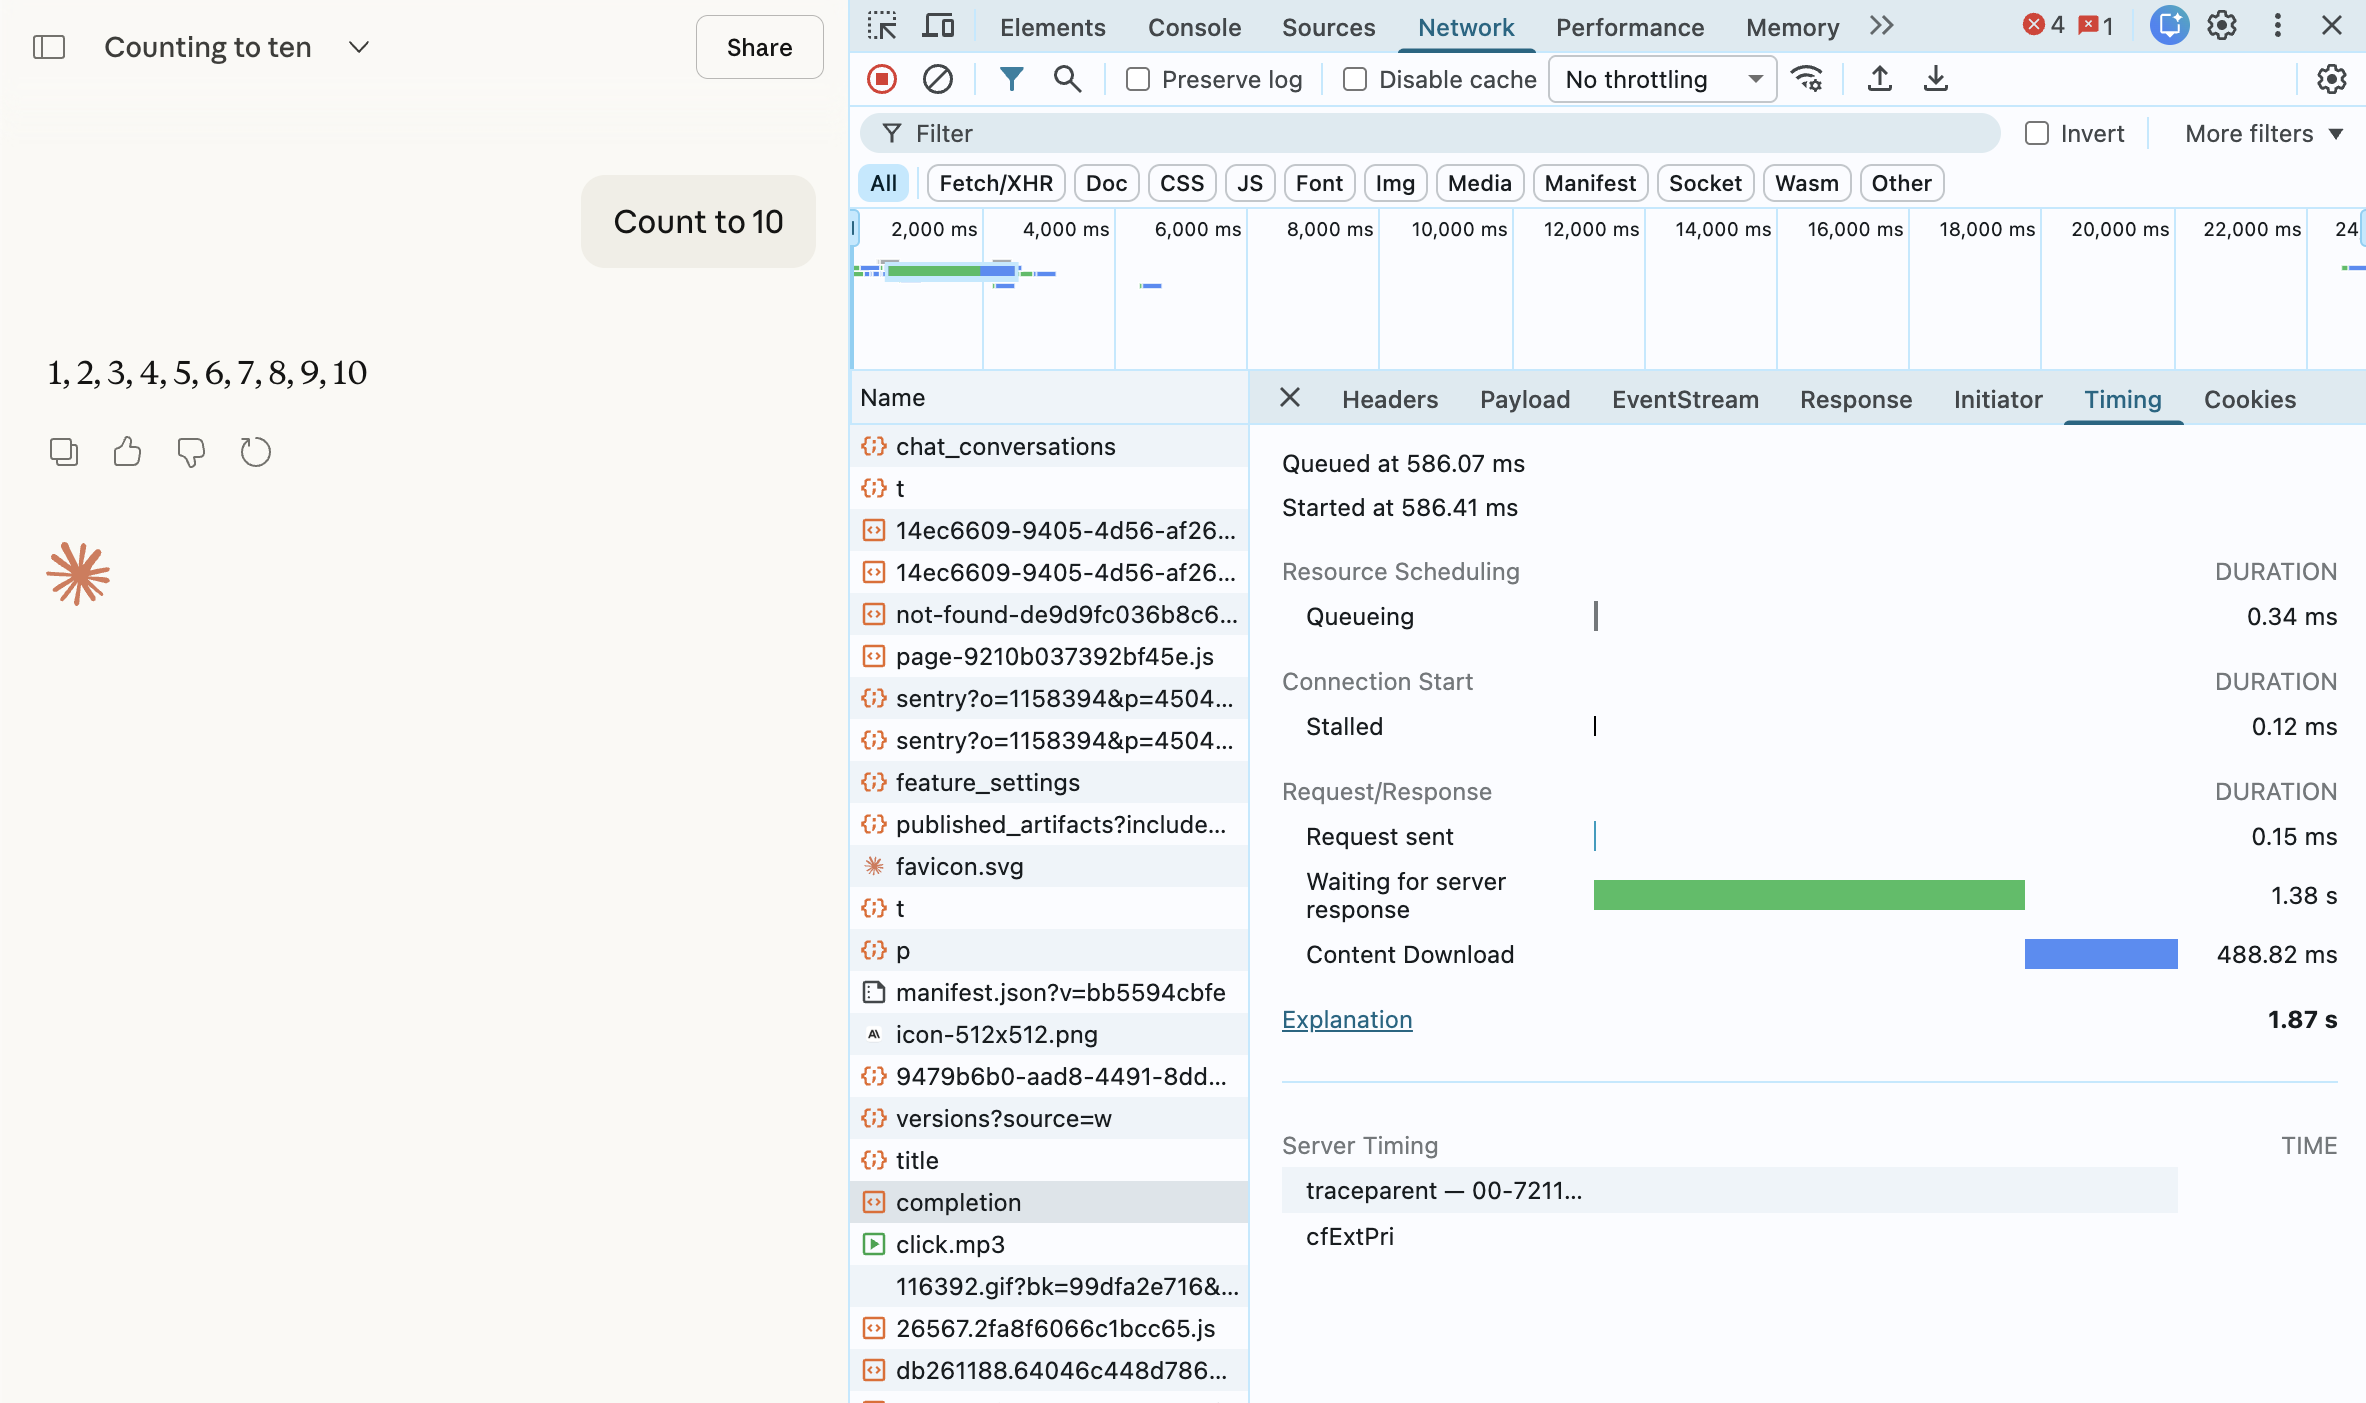
What to look for:
- Name: .../completion
- Status: 200
- Type: fetch or eventsource
- Time: How long the stream lasted
- Size: Total data transferred
Reading the Timing Tab:
Waiting (TTFB): Time until first byte
Content Download: How long streaming took
Click on the EventStream (or Response)
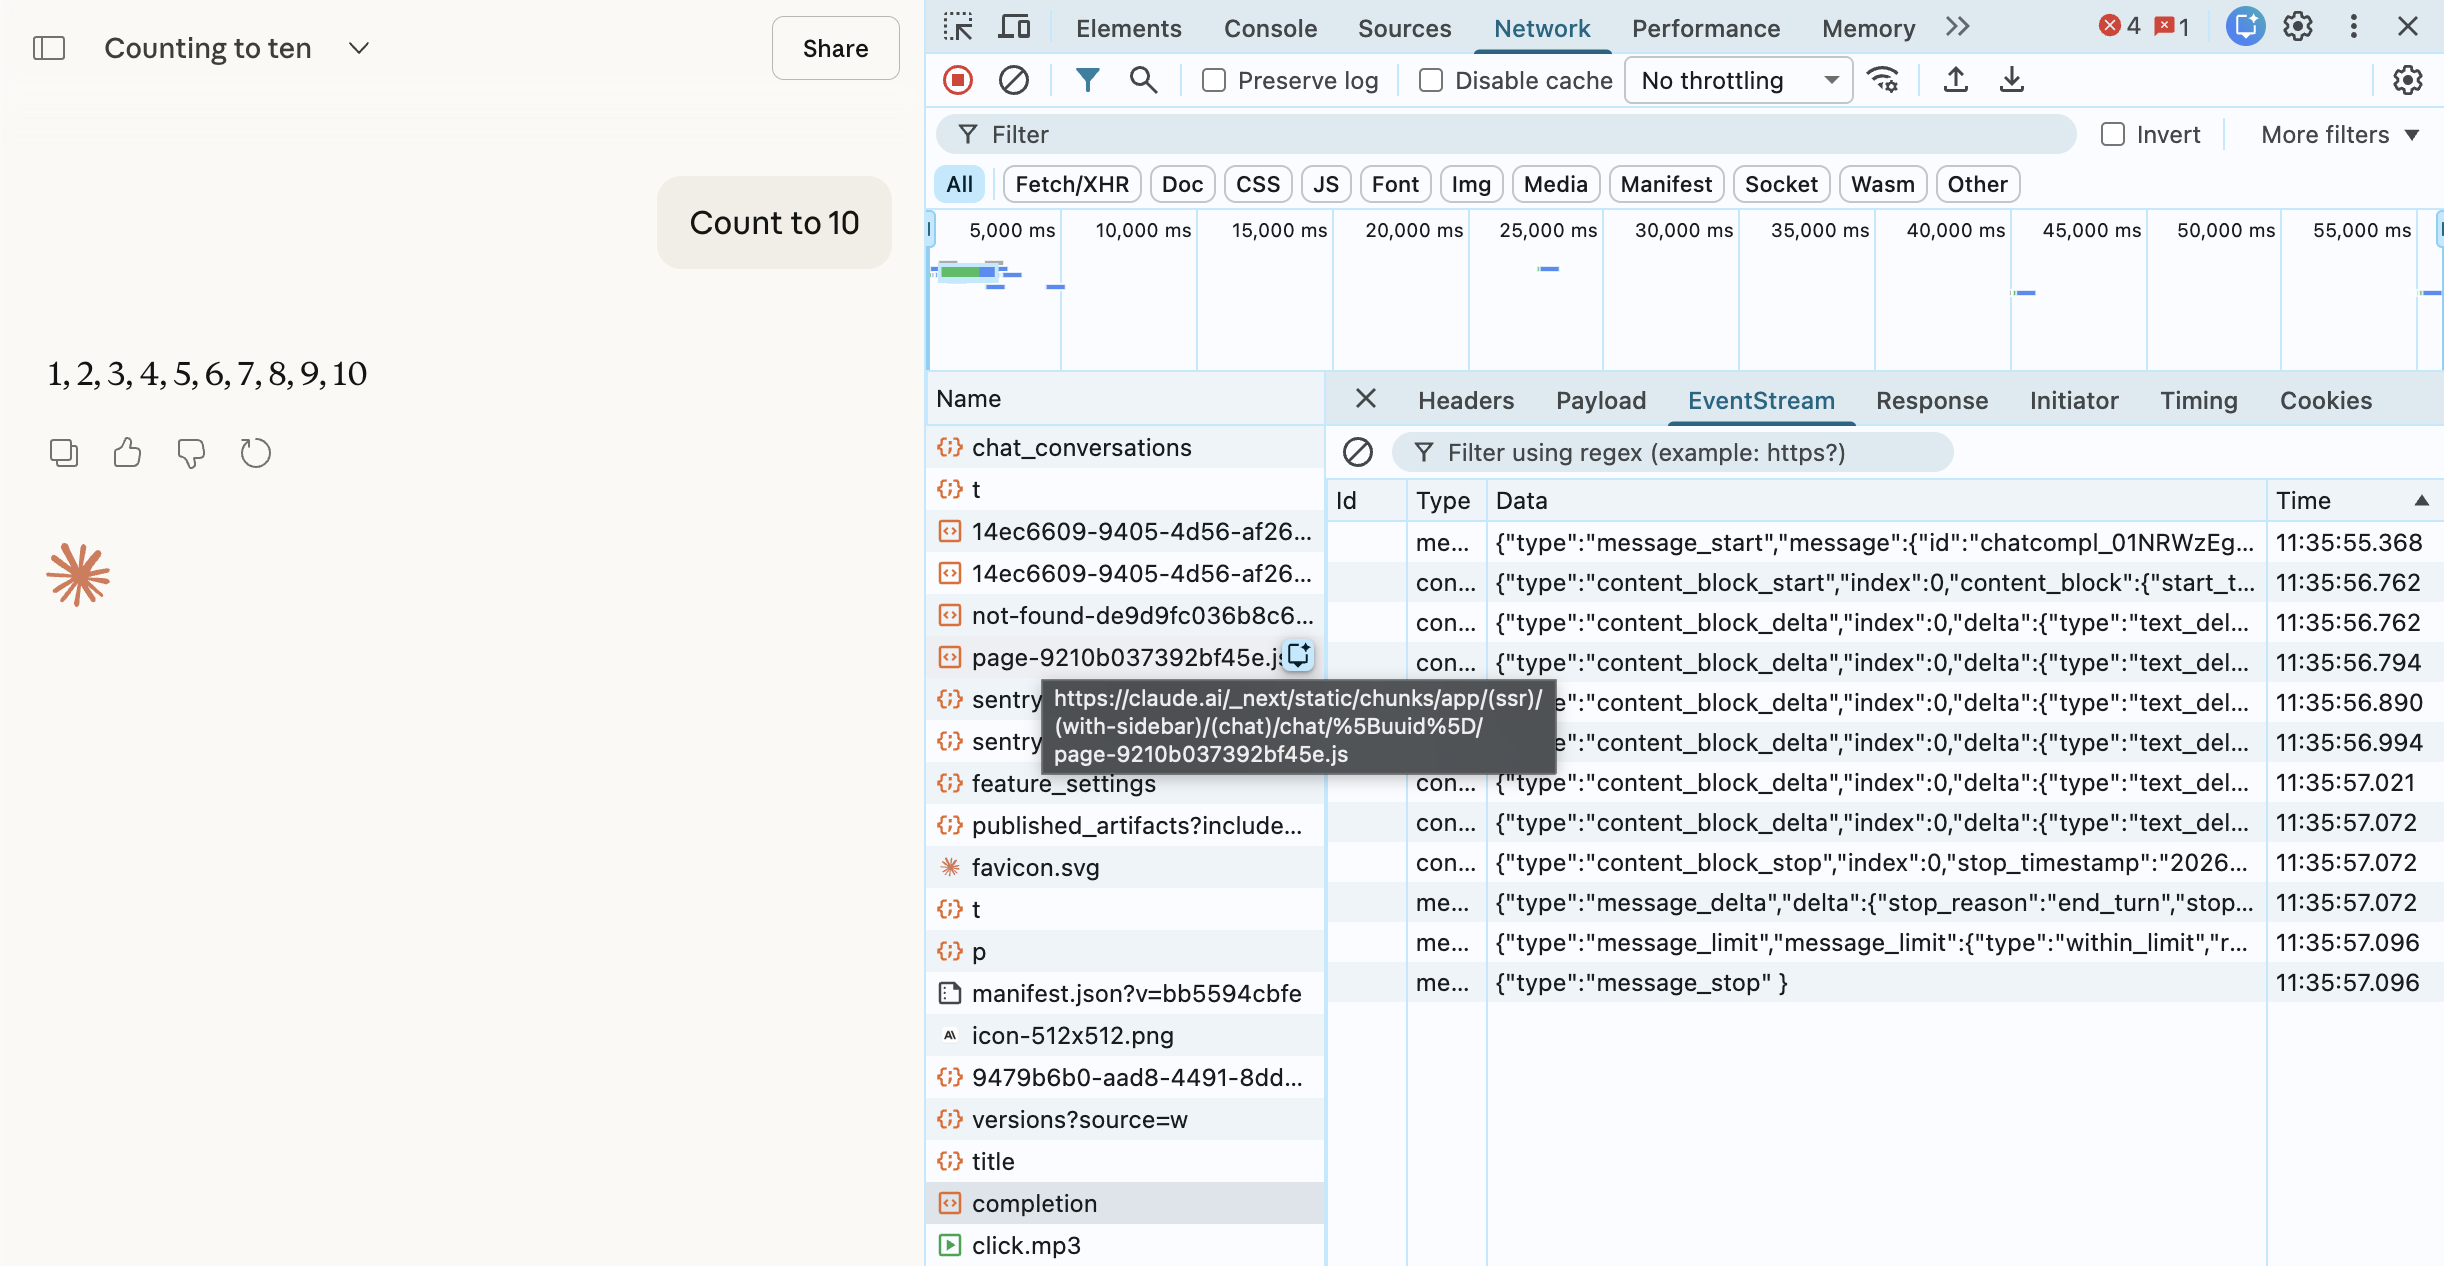
Each event: message block is one chunk!
Pretty cool. You can now take one more step further and write a simple script to basically look at a few important metrics. To get started, the most basic metrics I like to see the time it took to get the first chunk after I sent a message, how many chunks were received and the total time.
In your Chrome Developer Tools, navigate to the “Console” tab and paste this script (thanks Claude.ai):
// Monitor for Claude (SSE)
(function() {
    const originalFetch = window.fetch;
    window.fetch = async function(...args) {
        const start = Date.now();
        const response = await originalFetch(...args);

        const url = args[0];
        const contentType = response.headers.get('Content-Type');

        if (contentType && contentType.includes('text/event-stream')) {
            console.log('🔥 Streaming response detected!');
            console.log('URL:', url);

            const reader = response.clone().body.getReader();
            const decoder = new TextDecoder();
            let chunks = 0;
            let firstChunk = null;

            while (true) {
                const {done, value} = await reader.read();
                if (done) break;

                chunks++;
                if (!firstChunk) {
                    firstChunk = Date.now() - start;
                    console.log('⏱️ Time to first chunk:', firstChunk + 'ms');
                }
            }

            const total = Date.now() - start;
            console.log('📊 Total chunks:', chunks);
            console.log('⏰ Total time:', total + 'ms');
        }

        return response;
    };

    console.log('✅ Monitor active! Send a message to Claude.');
})();
Once you paste this in your console tab, you should see this message:
✅ Monitor active! Send a message to Claude.This time I asked Claude to count o 100. As you hit enter, the console tab should show our the below results:
🔥 Streaming response detected!
URL: /api/organizations/.../completion
⏱️ Time to first chunk: 2269ms
📊 Total chunks: 39
⏰ Total time: 4550ms
Pretty neat! Similarly you can capture these metrics for different AI Chatbot’s and view the user experience.
This is particularly useful to ensure positive user experience & satisfaction, driving operational efficiency and cost savings, optimizing performance, improving business outcomes and understanding scalability & capacity.
To make your user experience dashboard even more powerful, consider adding a few more advanced metrics. Here are a few ideas:
Calculate tokens per second (Measure Typing Speed)
// Calculate tokens per second
const startTime = Date.now();
let tokenCount = 0;

// Watch the DOM for changes
const observer = new MutationObserver(() => {
    const responseText = document.querySelector('.response-text')?.innerText || '';
    tokenCount = responseText.split(' ').length;
});

observer.observe(document.body, {
    subtree: true,
    childList: true
});

// After response completes, run:
const duration = (Date.now() - startTime) / 1000;
console.log('Tokens per second:', (tokenCount / duration).toFixed(2));
Check Connection Quality
// See all active connections
console.table(
    performance.getEntriesByType('resource')
        .filter(e => e.initiatorType === 'fetch' || e.initiatorType === 'xmlhttprequest')
        .map(e => ({
            name: e.name.split('/').pop(),
            duration: Math.round(e.duration) + 'ms',
            size: Math.round(e.transferSize / 1024) + 'KB'
        }))
);
Monitor Network Speed
// Check if you have slow connection
if (navigator.connection) {
    const conn = navigator.connection;
    console.log('Connection type:', conn.effectiveType);
    console.log('Downlink speed:', conn.downlink + ' Mbps');
    console.log('RTT:', conn.rtt + 'ms');
}
Tip: Bookmark this guide and test your AI platforms monthly - performance changes over time as models and infrastructure improve!
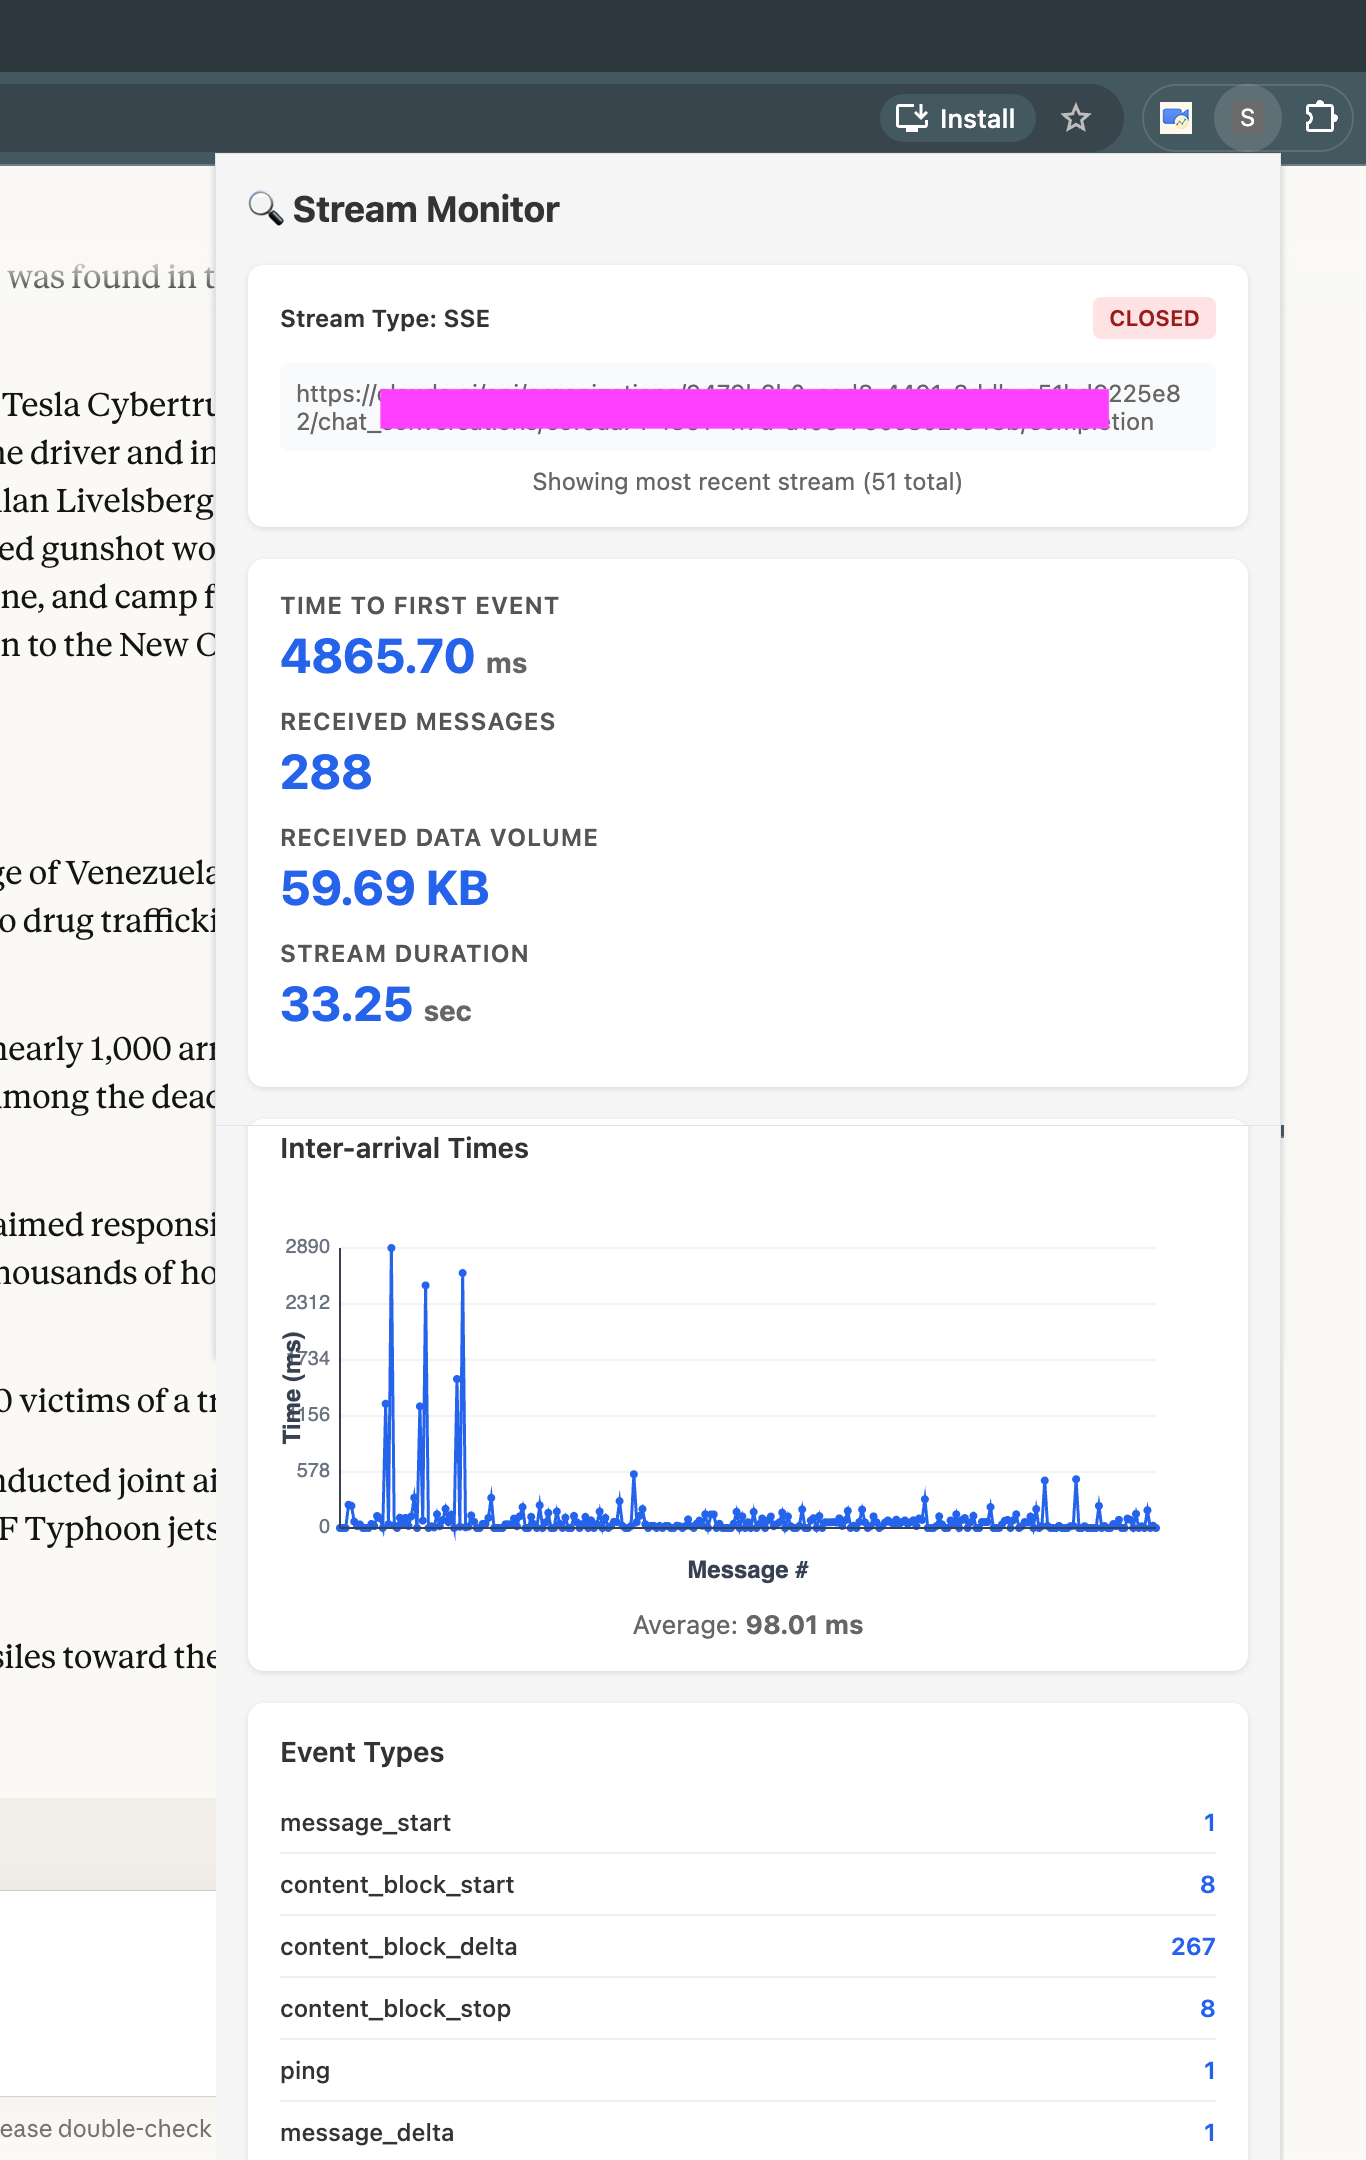
Besides that, you could also whip up a basic browser plugin that checks for SSE, XHR, or WebSockets and grabs the initial metrics of the chatbot you’re using. I made one for myself, and it’s been a handy way to figure out whether the issue is with my network or the chatbot itself.
