Measuring HTTP Performance
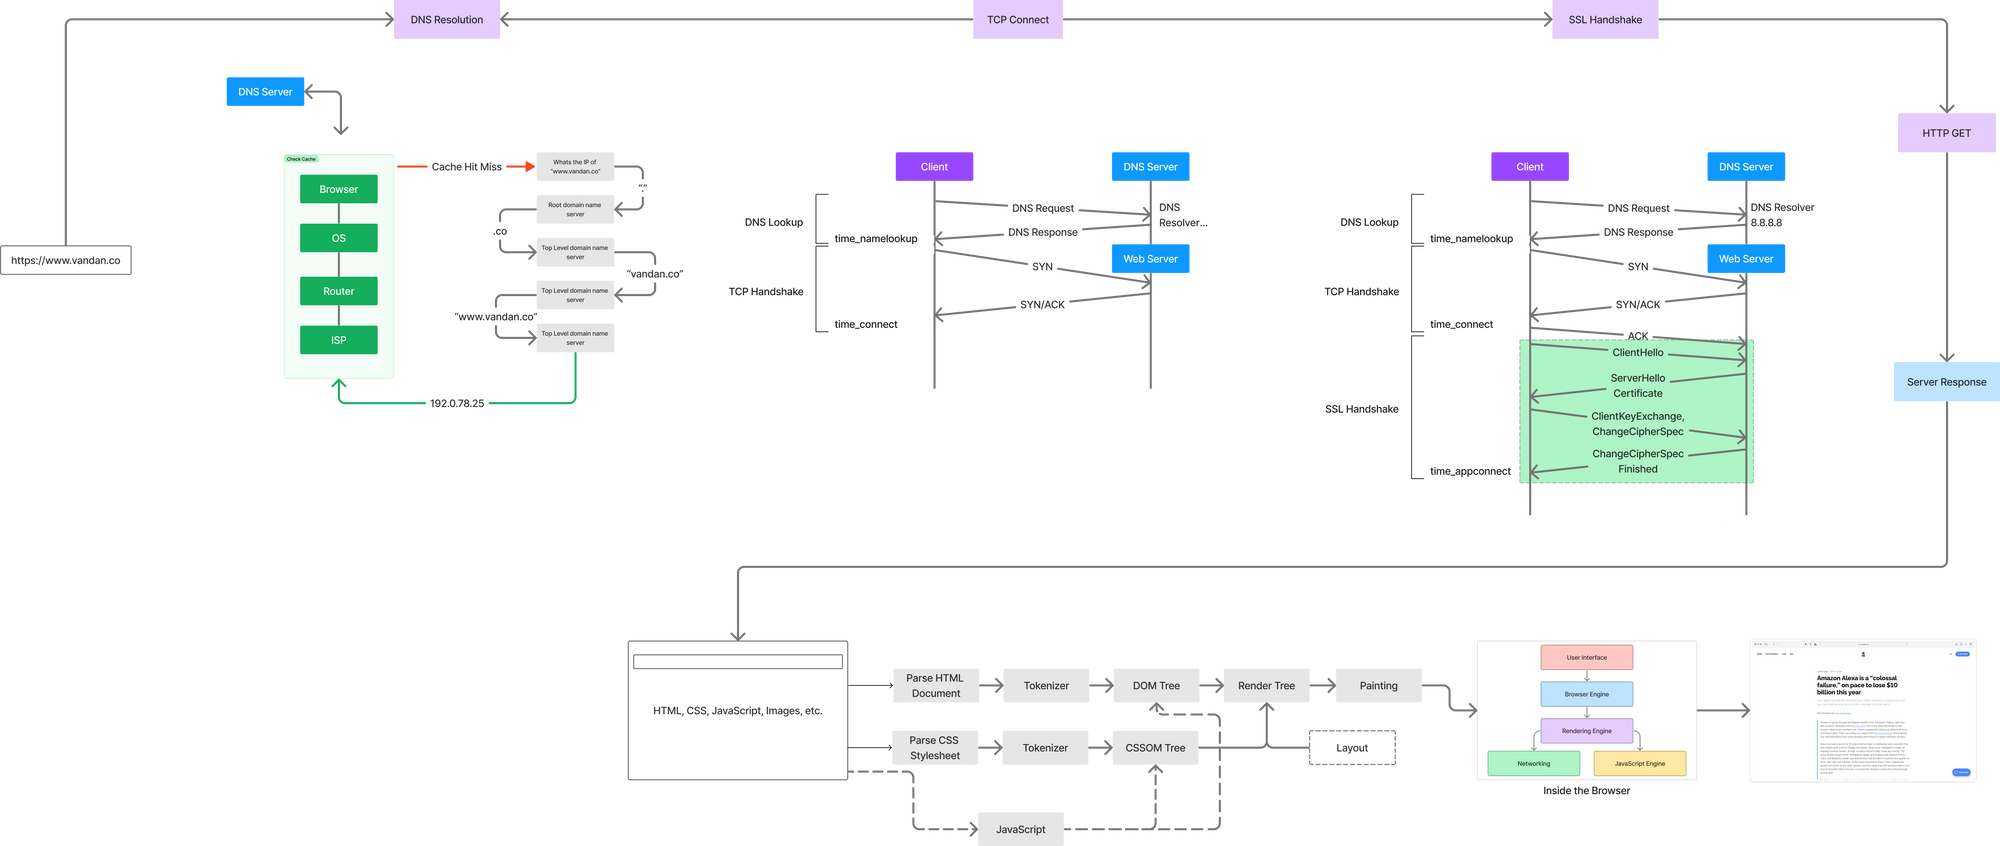
In order to effectively measure HTTP based application performance, it is important to understand what happens when you type a URL in a browser and hit enter.
Special thanks to Nithyanand Mehta for guiding me to write this article.
In order to effectively measure HTTP based application performance, it is important to understand what happens when you type a URL in a browser and hit enter. Lack of understanding HTTP under the hood leads to a lot of time wasted in debugging and troubleshooting. Without the basic understanding there is no way engineerings could troublehsoot let alone optimize wihtout understanding how HTTP works.
cURL is excellent utility/tool (my goto utility) for debugging web requests. Ever since I have interacted with API endpoints to build integrations, I have used cURL to verify and measure them - cURL also includes the ability to take timing measurements. Even Postman shows your cURL output when you are testing out API endpoints.
cURL is a good way to understand what happens when you enter a url in the browser. Keep in mind cURL simply measures the html and ignores JavaScript, images, etc. You can either configure a text file to format the output of cURL or simply use the below command:
curl --head -w "dnslookup: \t%{time_namelookup}\ntcp connect: \t%{time_connect}\nssl handshake: \t%{time_appconnect}\npretransfer: \t%{time_pretransfer}\nredirect: \t%{time_redirect}\nTTFB: \t\t%{time_starttransfer}\ntotal time: \t%{time_total}\n" https://www.vandan.co
I always recommend to create a cURL config file which makes it easier for you to format your output and avoid making typos while writing your command. You can read about Config files on everything.curl.dev:
You can easily end up with curl command lines that use a large number of command-line options, making them rather hard to work with. Sometimes the length of the command line you want to enter even hits the maximum length your command-line system allows. The Microsoft Windows command prompt being an example of something that has a fairly small maximum line length.
Or you can access my config file at https://github.com/vandancd/CurlTester 🖖🏽
Lets take a look at the output of the command we ran:
HTTP/2 200
server: openresty
content-type: text/html; charset=utf-8
status: 200 OK
x-request-id: c2c7e0eadb2689d35026c18e1dc64af9
etag: W/"67bf-ZGC6Do1Z1kO8Hvj76FI0aO0h1FI"
ghost-cache: MISS
cache-control: public, max-age=0
ghost-age: 0
x-request-id: c2c7e0eadb2689d35026c18e1dc64af9
via: 1.1 varnish, 1.1 varnish
accept-ranges: bytes
date: Tue, 13 Dec 2022 15:22:16 GMT
age: 36560
x-served-by: cache-ams12769-AMS, cache-sjc10044-SJC
x-cache: HIT, MISS
x-cache-hits: 4, 0
x-timer: S1670944936.358953,VS0,VE179
vary: Accept-Encoding, Cookie
ghost-fastly: true
alt-svc: clear
content-length: 26559

dnslookup: 	0.344530
tcp connect: 	0.452839
ssl handshake: 	0.575710
pretransfer: 	0.575894
redirect: 	0.000000
TTFB: 		0.864413
total time: 	0.864712
Note: The timings are always in seconds.
I ran the cURL against my blog which supports a minimum version of TLS 1.2 (we will dive deeper into this a bit later). Let’s try and understand each of these timing metrics against a typical HTTP request over TLS 1.2 connection.

This looks very simple but this is laid out in a very crude way. Lets take a deeper look at each block and see what each step does which will help explain some of those meta-data we captured in response headers.
DNS Resolution (time_namelookup)
This is the time (in seconds), it took from the start until the name resolving was completed. Lets see how name resolutions happens when the client sends a request and hits the DNS server.
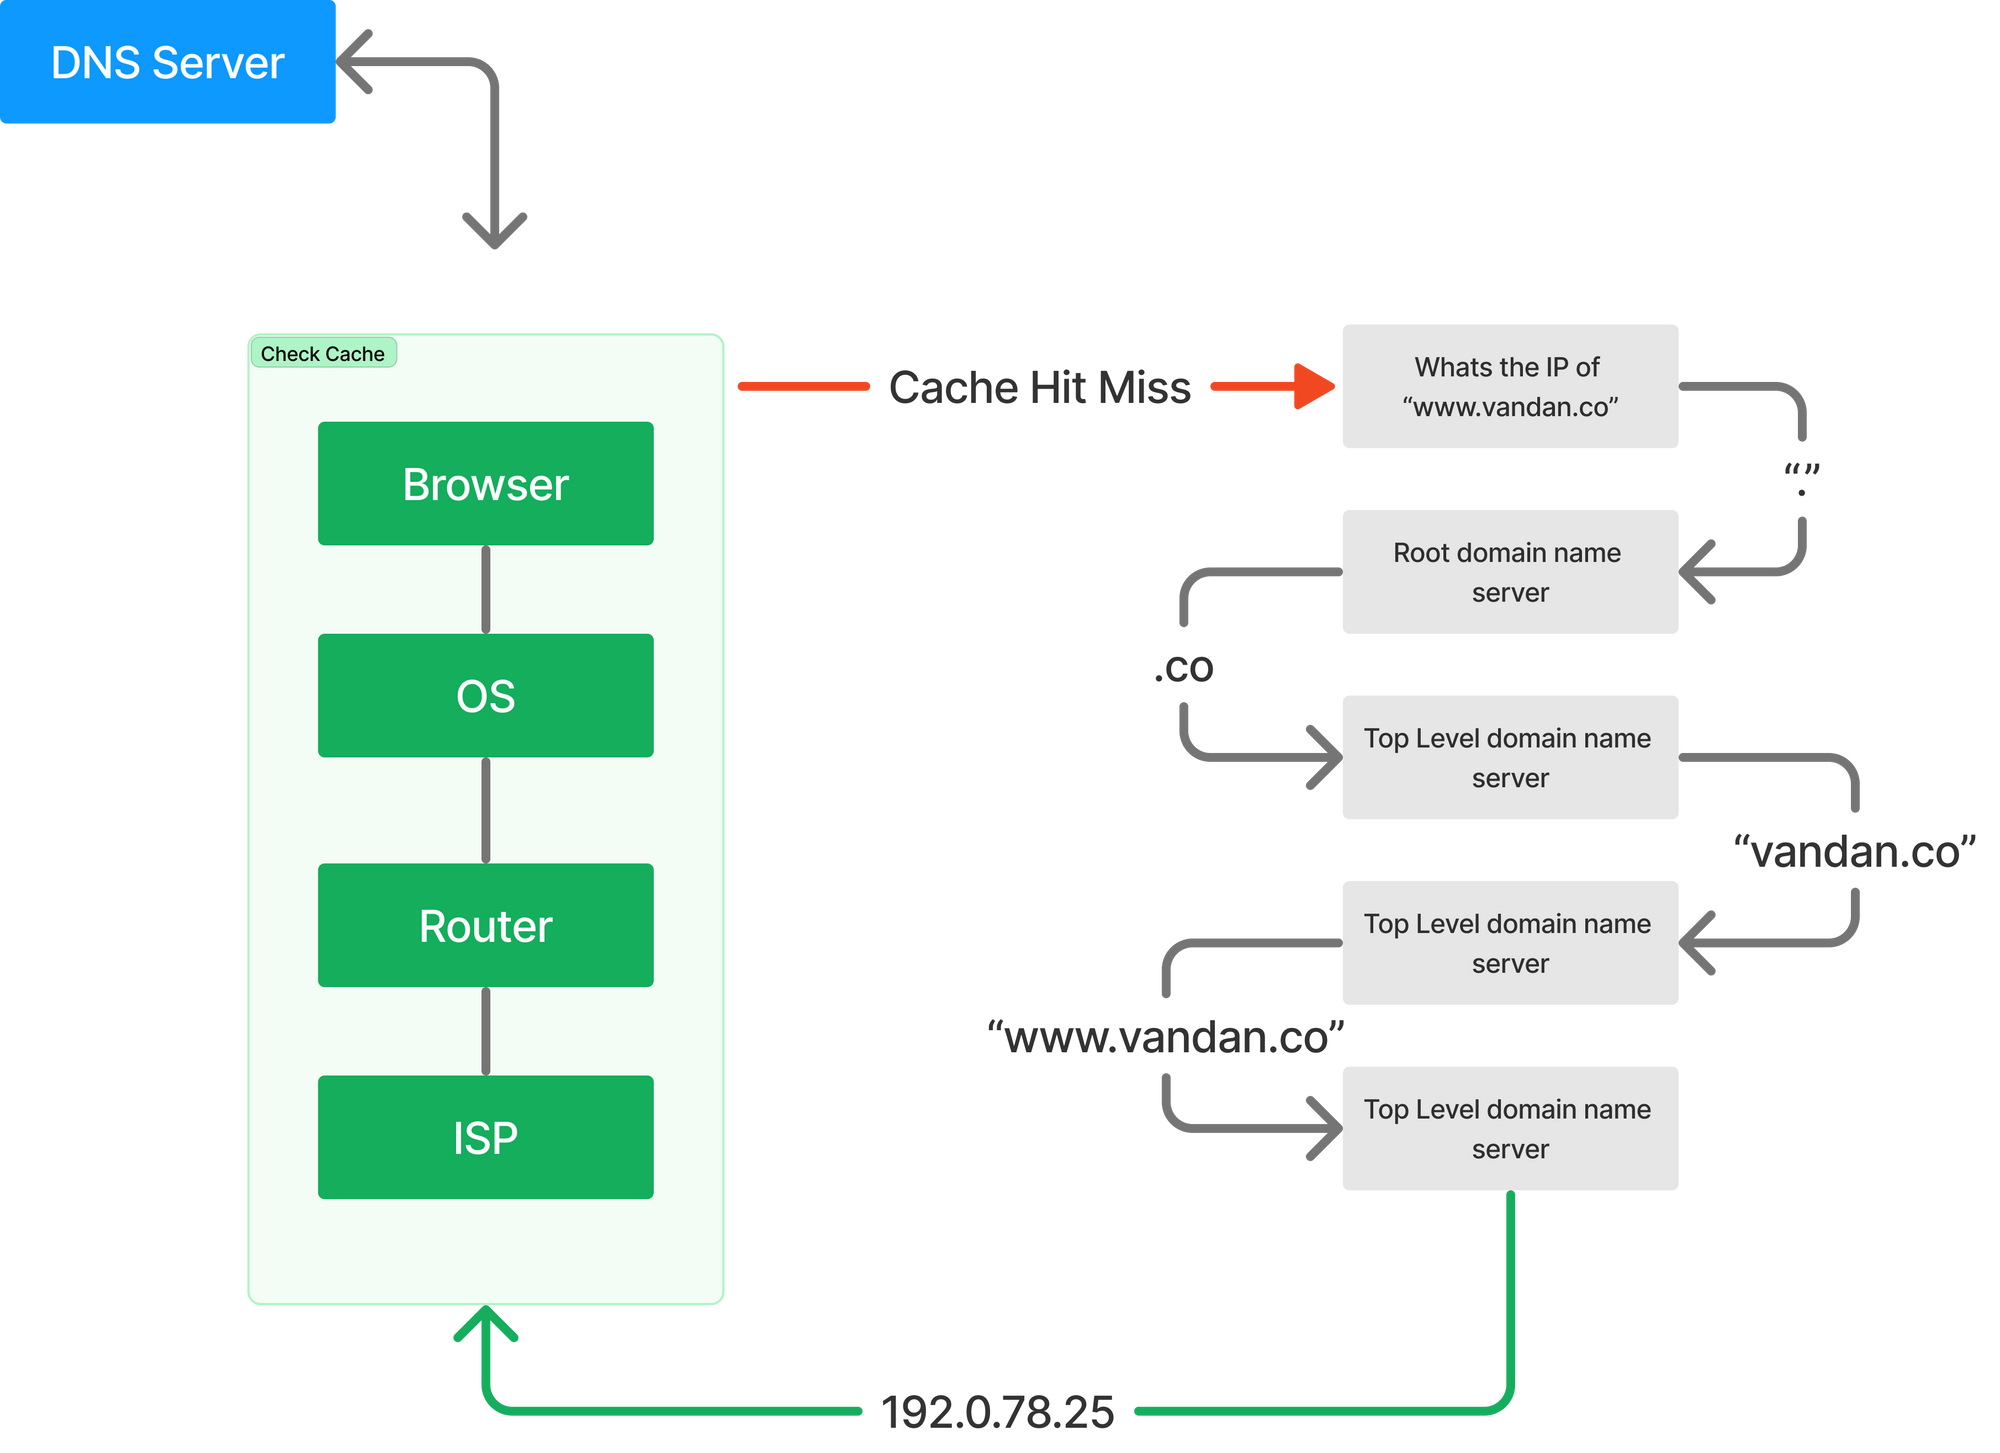
Until now we thought DNS was a single transaction step. The above diagram tells us a different story. Let’s take a look at how exactly this works.
- When you type in “vandan.co” in the browser, the query will first check your cache to see if there is in any way it can find what IP address “vandan.co” resolves to. This cache checks happens in the Browser, Operating System, Router or ISP - basically anywhere before it makes its internet journey to a DNS (recursive) server.
- If the cache check fails the query travels the internet and is received by a DNS recursive resolver.
- The result queries a DNS root nameserver (.).
- The root server responds with the address of a Top Level Domain (TLD) DNS server like .com or .net which stores the information of the domains. In our example its .co
- The resolver then will make a request to the .co TLD.
- The resolver will then respond with the IP address of the domain’s nameserver vandan.co
- Finally, the resolver sends a query to the domain’s nameserver.
- The IP address of vandan.co is then returned to the resolver from the nameserver.
- The DNS resolver then responds to the browser with the IP address of the domain requested initially.
At this point, once the client has the IP address, it moves to the next step to initiate a TCP connection.
Measuring DNS Performance
The best way you can measure your DNS performance (time) is using the dig (Domain Information Groper) utility. It comes preinstalled with on macOS and Linux. If you are on a windows machine, you will need to download this utility.
To know how long it takes to resolve your DNS (aka DNS performance) run the command $ time dig vandan.co. You will see the below output:
~ time dig vandan.co

; <<>> DiG 9.10.6 <<>> vandan.co
;; global options: +cmd
;; Got answer:
;; ->>HEADER<<- opcode: QUERY, status: NOERROR, id: 3220
;; flags: qr rd ra; QUERY: 1, ANSWER: 1, AUTHORITY: 0, ADDITIONAL: 1

;; OPT PSEUDOSECTION:
; EDNS: version: 0, flags:; udp: 1232
;; QUESTION SECTION:
;vandan.co.			IN	A

;; ANSWER SECTION:
vandan.co.		900	IN	A	178.128.137.126

;; Query time: 29 msec
;; SERVER: 2001:558:feed::1#53(2001:558:feed::1)
;; WHEN: Tue Dec 13 10:06:07 EST 2022
;; MSG SIZE  rcvd: 63


________________________________________________________
Executed in   43.67 millis    fish           external
   usr time    1.31 millis   41.00 micros    1.27 millis
   sys time    9.47 millis  763.00 micros    8.71 millis
Notice the line ;; Query time: 29 msec. Very close to the time we see in our cURL command as well. Now this is measured from a single machine at my home - thats just one metric. It is essential to conduct your tests from other locations to get more accurate findings.
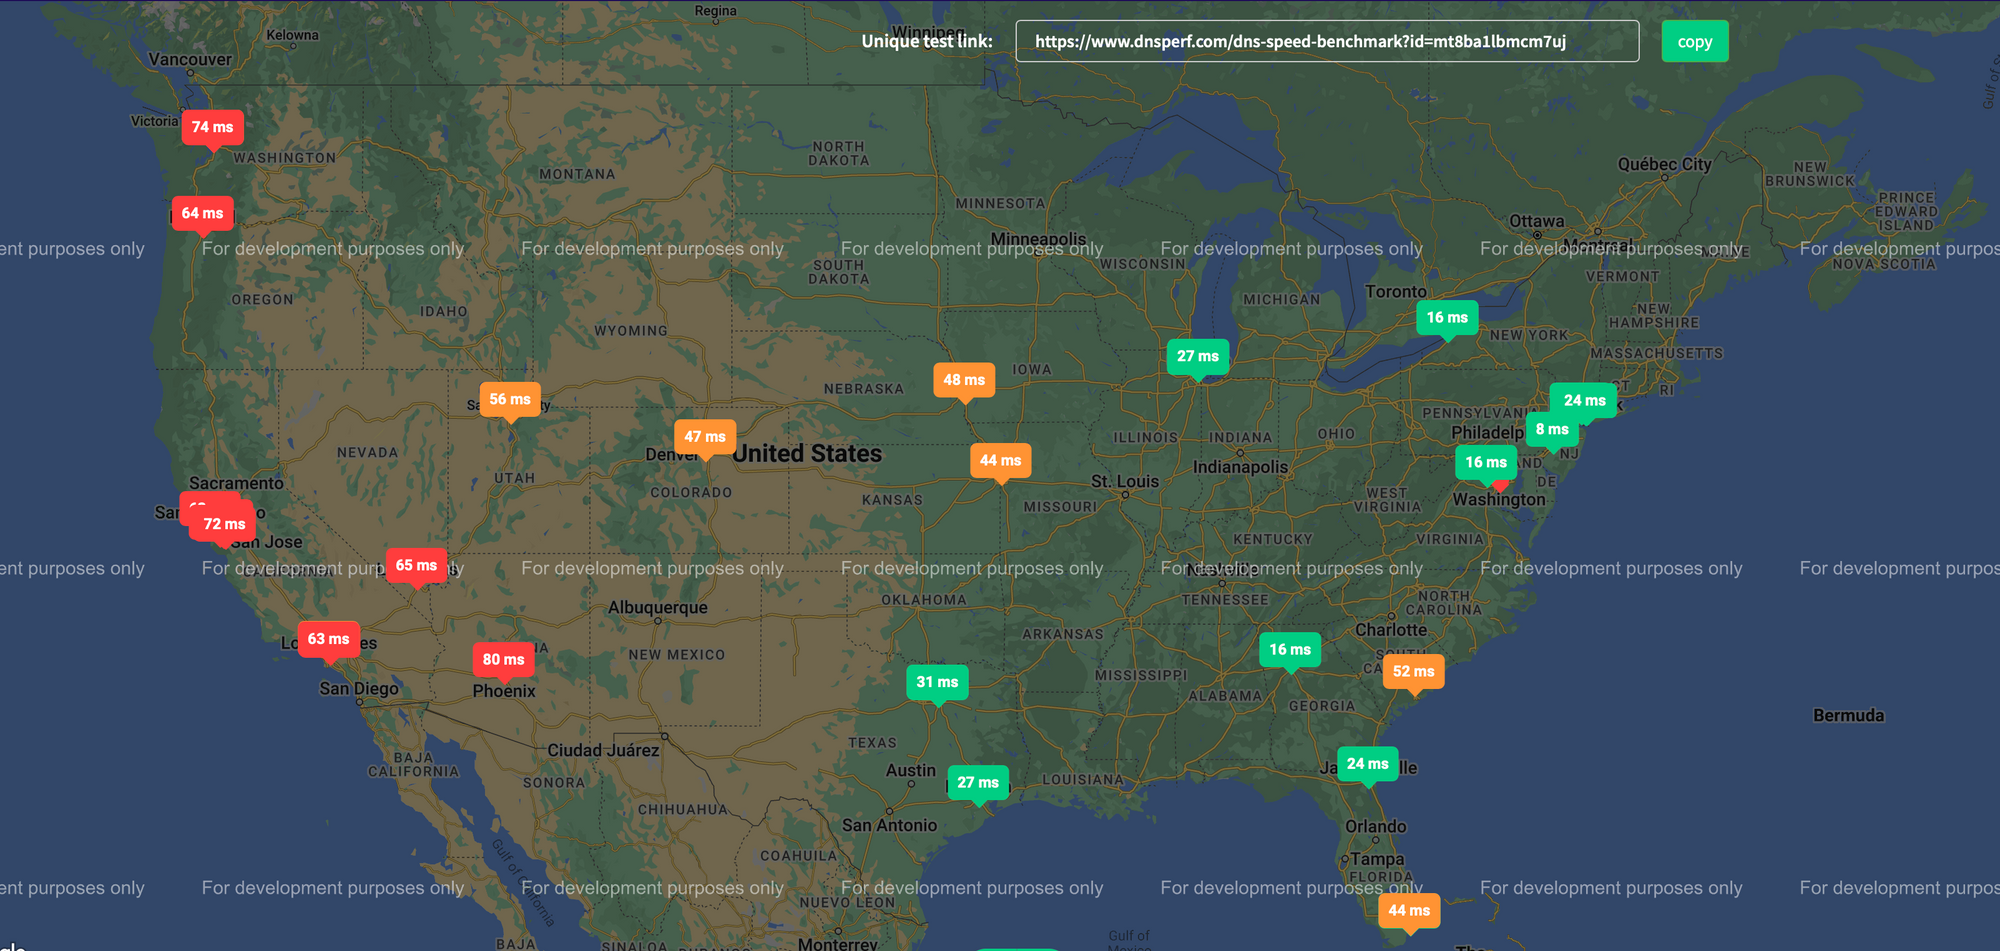
You can also use sites like DNSPerf that allows you to check your DNS performance from several locations. I ran this on my site to see how the DNS resolutions time for my site is acorss the US.
TCP Connect (time_connect)
This is the time (in seconds), it took from the start until the TCP connection to the remote host (or proxy) was completed.
TCP uses a three-way handshake to establish a reliable connection. The connection is full duplex, and both sides synchronize (SYN) and acknowledge (ACK) each other. The exchange of these four flags is performed in three steps - SYN, SYN-ACK, and ACK.
The client (in our case cURL) will choose an initial sequence number which is set in the first SYN packet. The server also chooses its own initial sequence number, set in the SYN/ACK packet. Each side acknowledges each others sequence and acknowledgement numbers which will allow both the sides to detect missing or mis-ordered segments.
Once a connection is established, ACK will typically follow for each segment. The connection will eventually end with a RST (reset) or FIN (end gracefully.
When you look at the TCP connection and how its established - it is clear that once the DNS resolution happens the client is now starting to communicate with the web server (unless a proxy is involved).
The above can be envisioned as follows now:
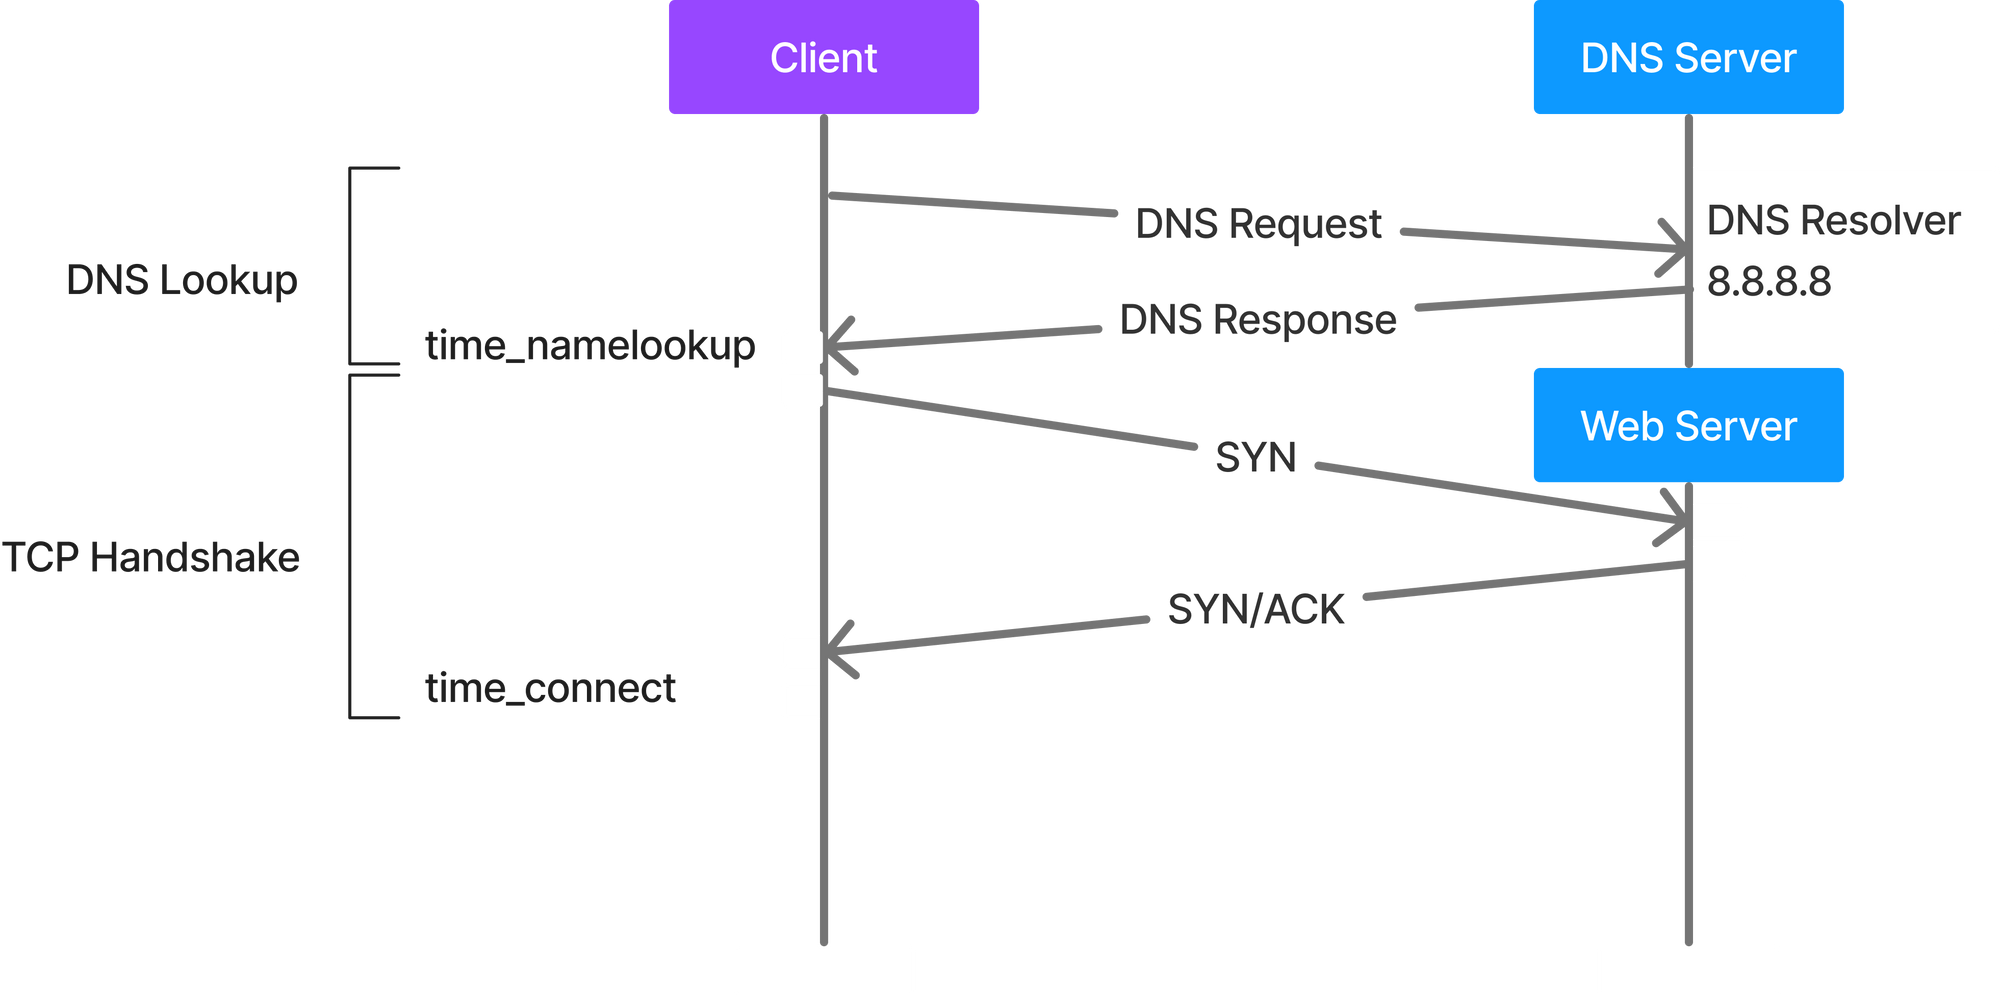
You can now see that in HTTP, the client has to speak first. This makes it very easily to blindly assess the service latency on the initial HTTP request on a TCP connection. If you look at the phone metaphor, you can simply watch the phones and measure the time between the first ring and the first word spoken by the receiver. Thus, to measure the overall servie latency, you simply need the first TCP SYN packet in and the first non-zero payload packet out on a given TCP/IP connection.
You can usetcpdump (on macOS and Linux) or Wireshark (Windows included) utility to measure this. Theo Schlossnagle explained very well on how to measure latencies via TCP analysis.
It isn’t like we can ping the remote machine. Instead we need to calculate this passively. TCP has this really inconvenient 3-way handshake that starts up a session that goes something like:
1. Client: “I’d like to ask you to tell me a joke.”
2. Server: “Okay, ask away”
3. Client: “Okay, I’d like you to tell me a joke about TCP.”
4. Server: “These two packets walked into a bar…”
From the TCP nitty-gritty, if we measure the time from the first SYN to the subsequent ACK package (before any data has transited), we have a rough estimation of the roundtrip time between the client and server. If we measure between observing (1) and sending (4), the part that we’re missing is the time between (1) being sent by the client and arriving at the server and (4) being sent and arriving at the client. That is approximately one roundtrip.
So, long story summarized. If we take the time between observing 1 and 4 and add the time between observing 2 and 3, we should have a rough approximation of the total time the client witnessed between making the request and receiving the first byte of the response.
What is HTTP/2 and how does it different form HTTP/1.1?
When you ran the cURL command, in the header the very first line confirms two things for us.
- What
HTTPprotocol was used - If the connection to the server was successful or not with an
HTTPresponse code - in our case200.
HTTP/2 200
Let’s take a little bit of a detour to understand as this is very important. HTTP/1.1 was the first standardized version that was available for use in 1997. When this came out, it was a game changer as it had performance optimization over its precursors and it changed how communications was handled between clients and severs.
HTTP/1.x was known to have poor response time. And you can see why that is the case as it requires 3 TCP connections (as explained above). With websites become more resources intensive, the protocol was loosing its efficiency. It was no longer HTML text, but complex objects like JavaScript files, CSS and images as well. It became important to minimize latency and boost page load speeds.
Google looked into this, proposed an experimental project SPDY in 2010 and later after extensive testing form IETF, Google, Microsoft and Facebook HTTP/2 was fully released in 2015.
From web.dev introduction to HTTP/2: Why not HTTP/1.2?
To achieve the performance goals set by the HTTP Working Group, HTTP/2 introduces a new binary framing layer that is not backward compatible with previous HTTP/1.x servers and clients—hence the major protocol version increment to HTTP/2. That said, unless you are implementing a web server (or a custom client) by working with raw TCP sockets, then you won’t see any difference: all the new, low-level framing is performed by the client and server on your behalf. The only observable differences will be improved performance and availability of new capabilities like request prioritization, flow control, and server push.
HTTP/1.1 sends messages as plain text, and HTTP/2 encodes them into binary data and arranges them carefully. This implies that HTTP/2 can have various delivery models.
When the client sends a request; the initial response in return for an HTTP GET request is not the fully loaded page. Fetching additional resources form the server requires that the client send repeated requests, and break or form the TCP connection repeatedly. This process is resource and time intensive.
HTTP/1.1 creates a persistent connection between server and client, until explicitly closed, this connection will remain open. Thus, the client can use one single TCP connection through the communication without an interruptions.
This approach is great for performance but has one big problem. The way TCP connections work is that if a request at the queue head cannot retrieve the required resources, it can blow all the requests behind it (aka head-of-line blocking or HOL blocking).
This was the reason HTTP/1.1 creates multiple TCP connections as its essential.
To really understand this, here is a great article by Macoy Madison:
TCPguarantees reliability in regards to the stream; it does not guarantee that everysend()wasrecv()'d by the connection. This distinction is important.
If Isend()a message, I have no guarantees that the other machine willrecv()it if it is suddenly disconnected from the network.
HTTP/2 introduced a binary framing layer. This layer partitions requests and responses in tiny data packets and encodes them. Due to this, multiple requests and responses can run in parallel which makes any chances of HOL blocking a lot less.
Learn more about the HTTP/2 advances - https://www.wallarm.com/what/what-is-http-2-and-how-is-it-different-from-http-1.
SSL Handshake (time_acppconnect)
Once again the way SSL handshake happens largely depends on what version of TLS is being used.
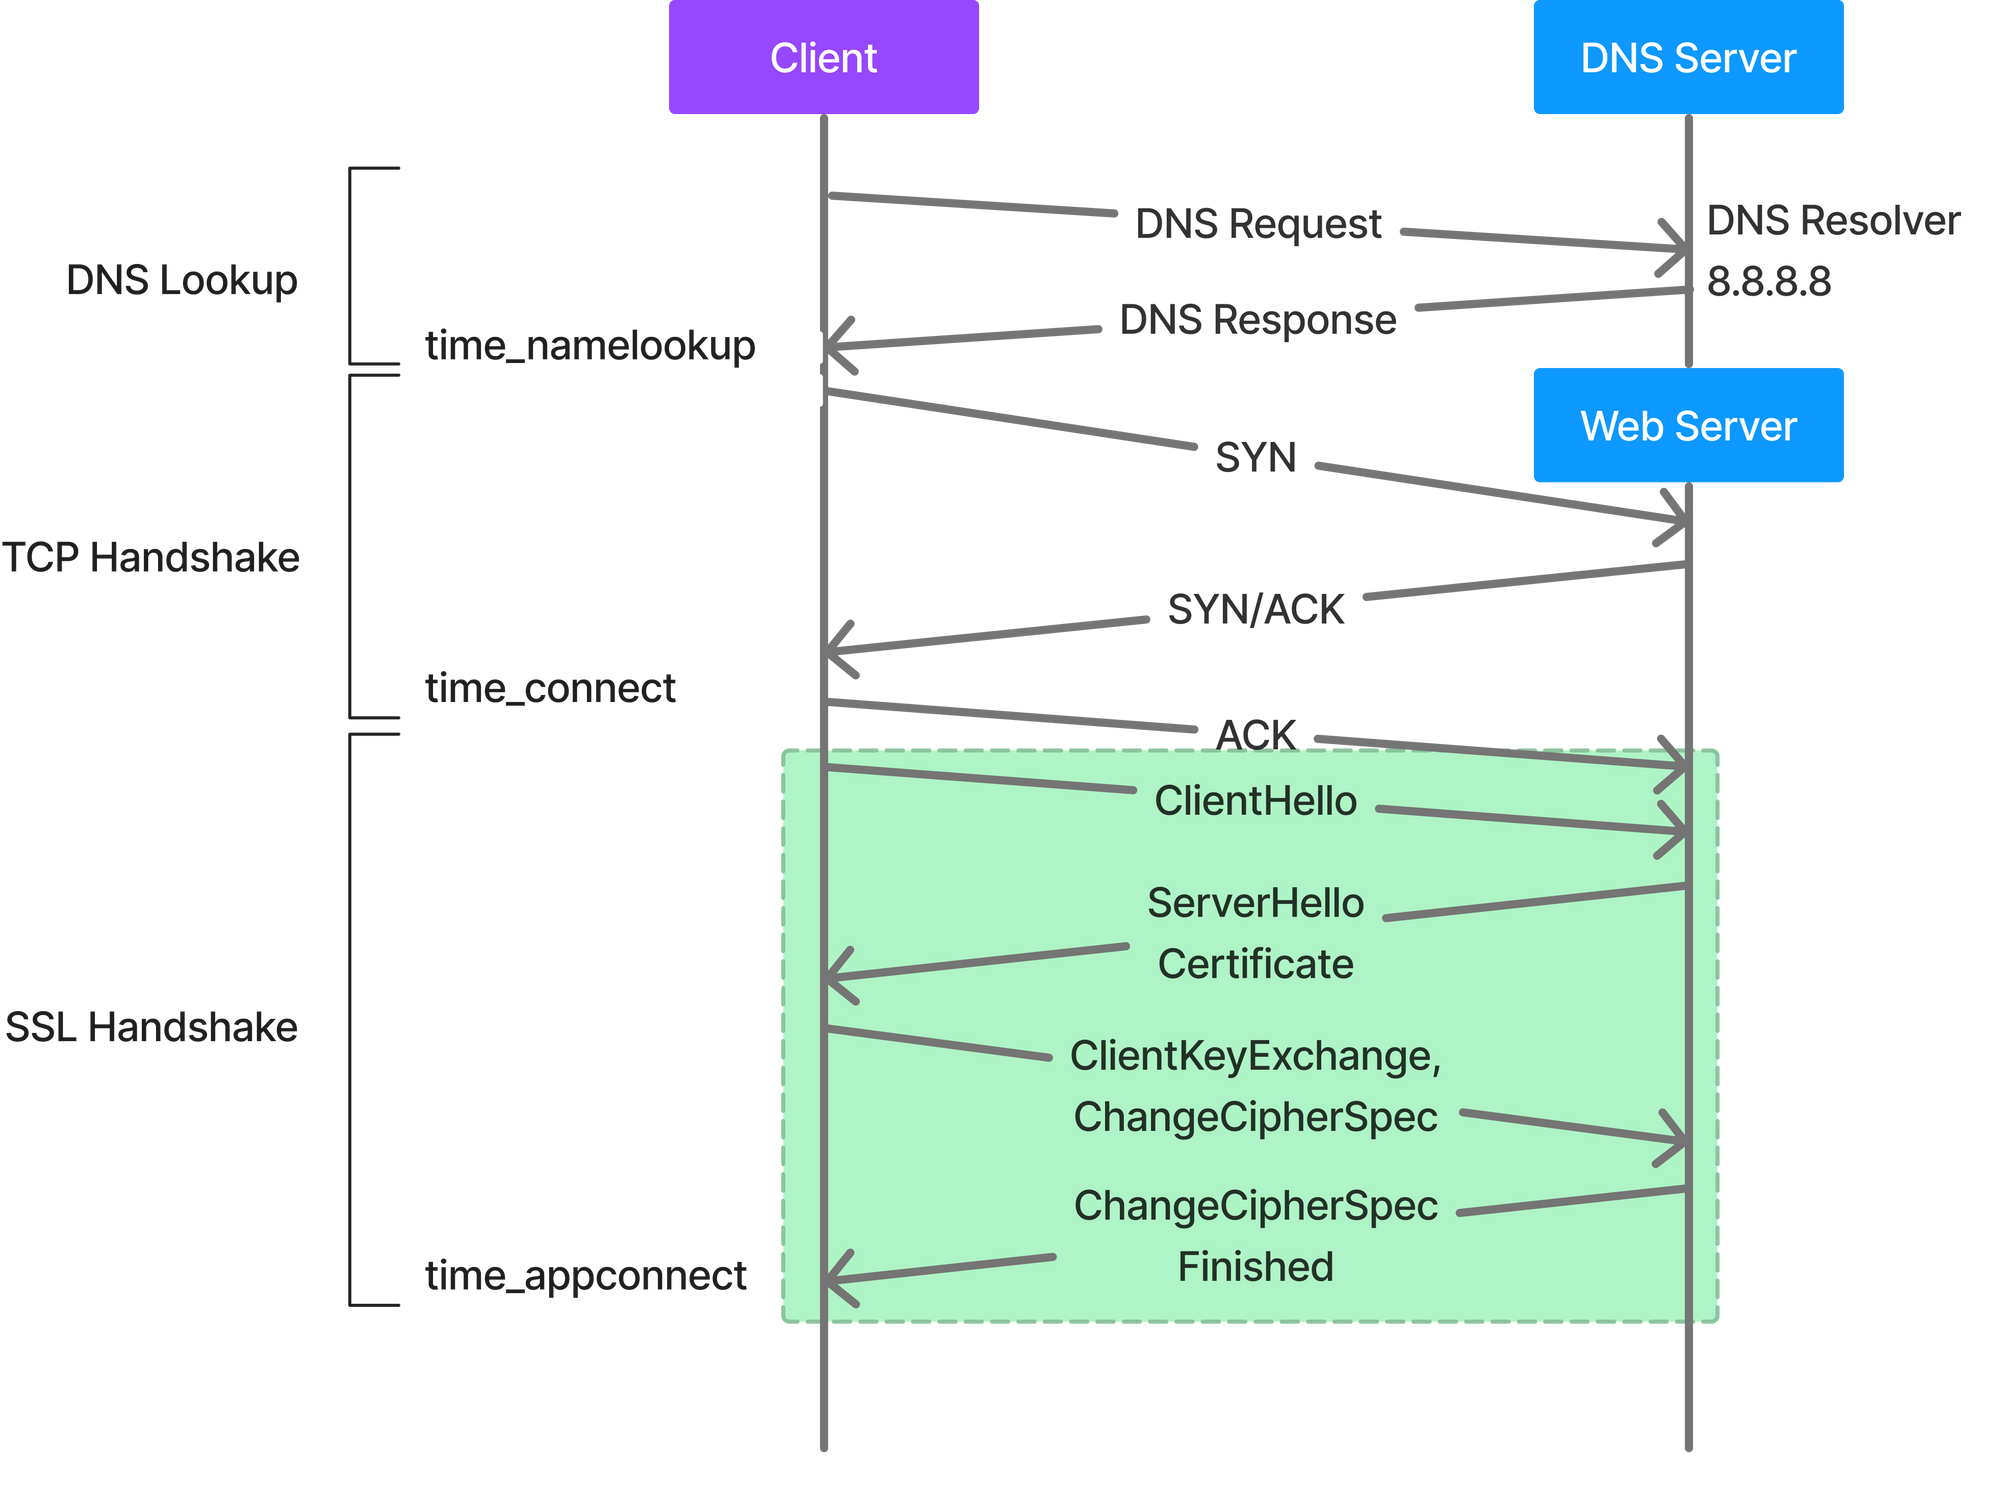
TLS 1.2
- The client sends a message to the server called the
ClientHellothat essentially tells the server that it wishes to speakTLS 1.2, with one of these cipher suites. - The server receives that and answers with a
ServerHelloand confirms to speakTLS 1.2and chooses a cipher suite. Along with the cipher suite, it also sends back its key share (the specifics of the key share changes based on the cipher suite selected). - Finally, the server sends the website certificate (signed by the CA) and a signature on portions of
ClientHelloandServerHello, including the key share, so the client knows that these are authentic. - Post this, the clients then generates its own key share, mixes it with the server key share, and thus generates the encryption keys for the session.
- Finally, the client sends the server its key share, enables encryption and sends a
Finishedmessage (hash of a transcript of what has happened so far). The server does the same and sends its ownFinishedmessage.
At this point this process is complete. The important part of this entire transaction is for the client and server to agree on a cryptographic key.
TLS 1.3
TLL 1.3 takes one less round trip.
- The client starts by sending the
ClientHello, list of supported ciphers and makes a guess as to which key agreement algorithm the server will choose, and sends a key share for that. Thus, saving an entire round trip. - The server responds with the
ServerHello, its key share, the certificate (encrypted, as it already has a key) and the Finished message. - Client receives all that, generates the keys, checks the certificates, and
Finishedand its immediately ready to send theHTTPrequest.
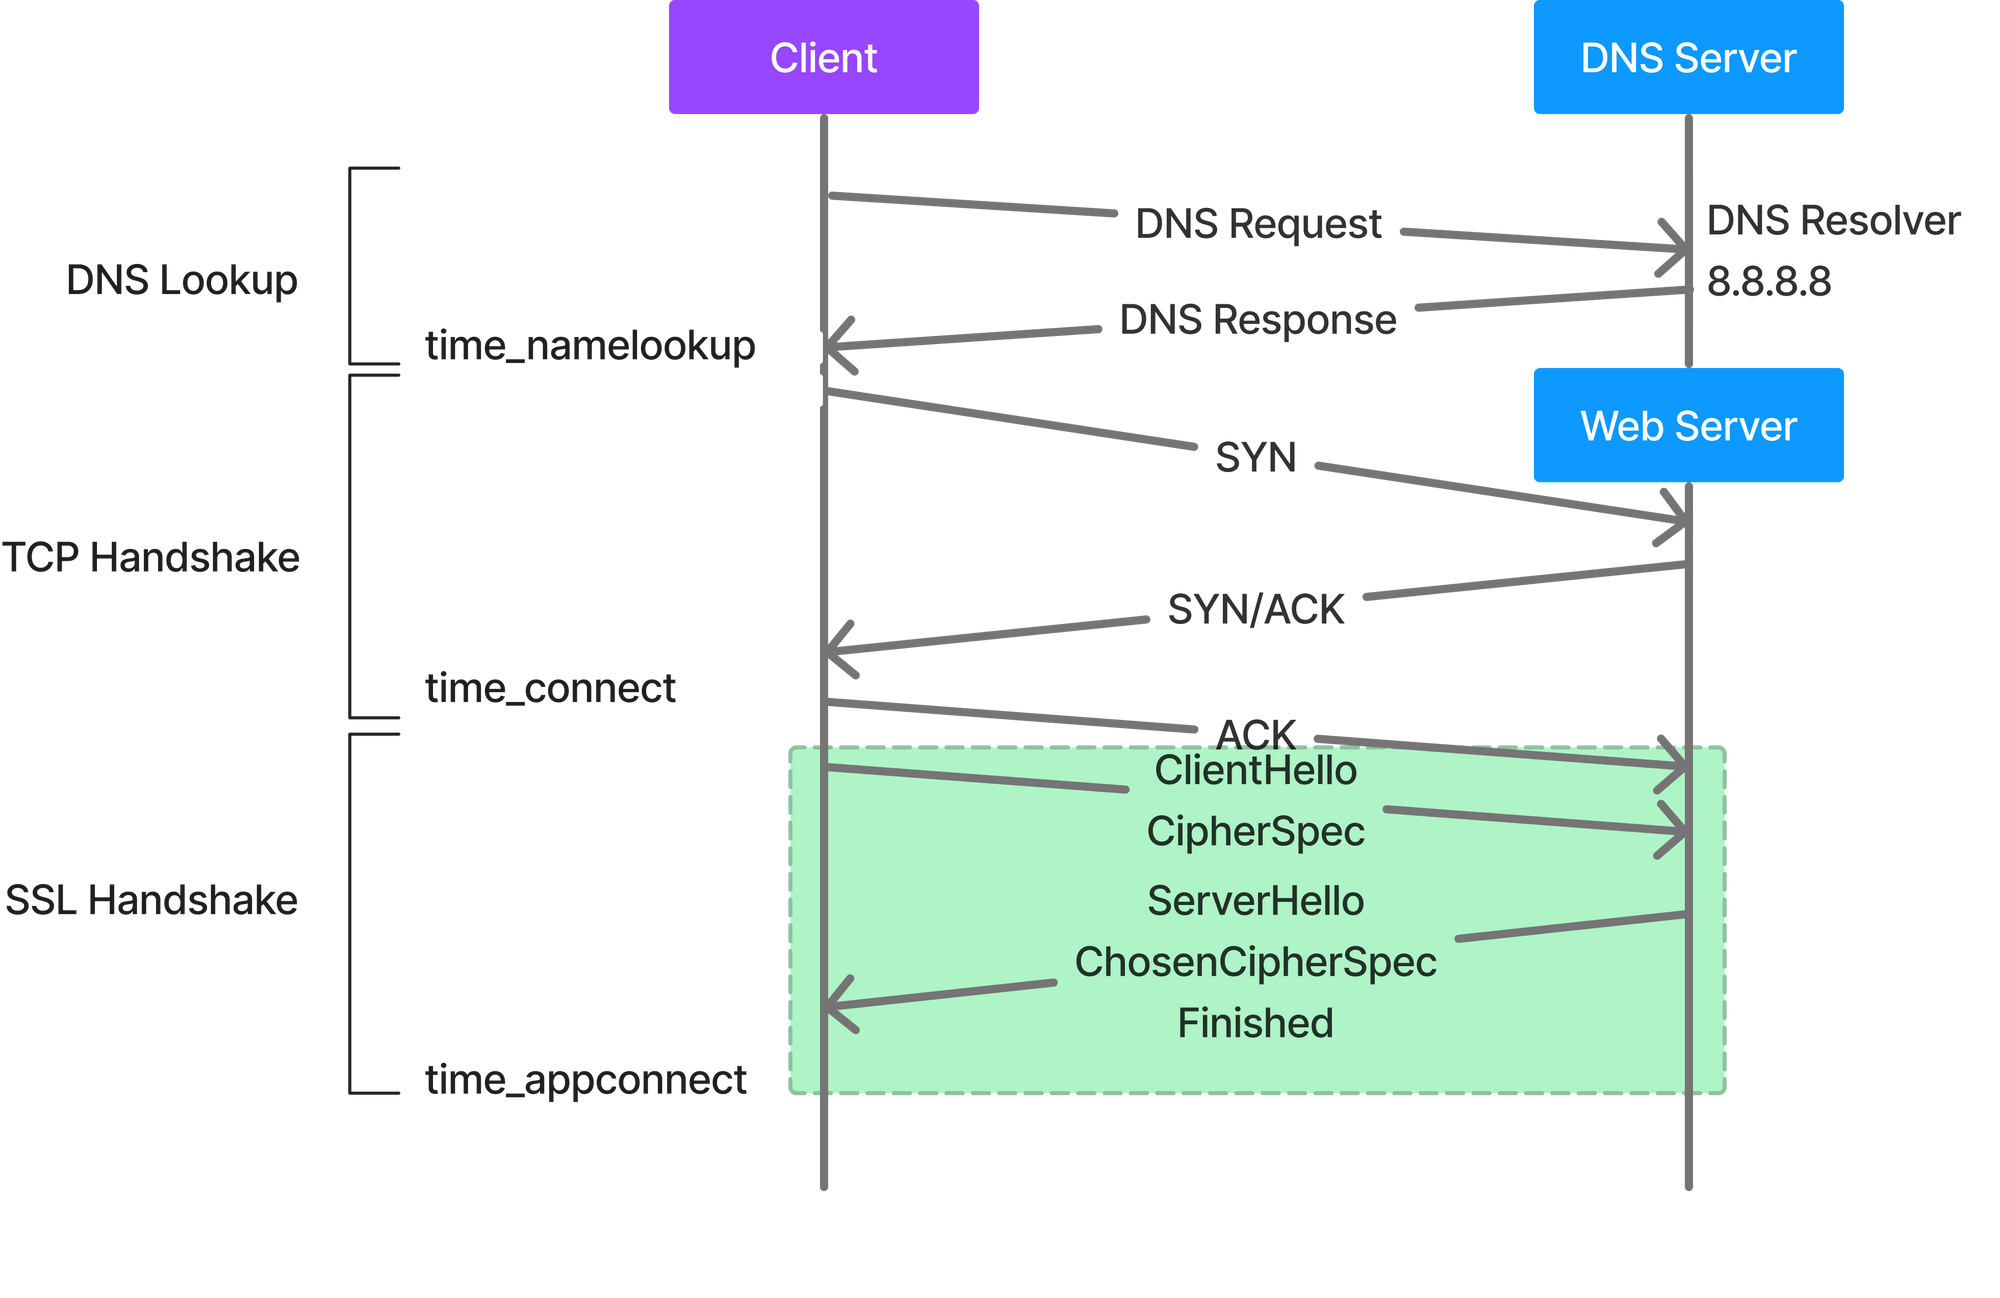
This could easily help reduce hundreds of milliseconds. TLS 1.3 is better in comparison to TLS 1.2, even when doing resumption.
You can read more about the difference between the two protocols at https://blog.cloudflare.com/tls-1-3-overview-and-q-and-a/
You can also read about how HTTPS works. This is one of my favorite websites especially when someone is new to this subject and is tryin to understand how security in general works.
Measuring SSL Handshake Performance
openssl is proably the most common library used today and has a variety of utilities within itself to test varios scenarios includig measuring SMTP, IMAP performance to looking how how long does an SSL Handshake take for a give website.
To measure your SSL handshake performance run the command $ openssl s_time -connect vandan.co:443. You will see the below output:
Collecting connection statistics for 30 seconds
********************************************************************************************

92 connections in 0.25s; 361.77 connections/user sec, bytes read 0
92 connections in 30 real seconds, 0 bytes read per connection


Now timing with session id reuse.
starting
rrrrrrrrrrrrrrrrrrrrrrrrrrrrrrrrrrrrrrrrrrrrrrrrrrrrrrrrrrrrrrrrrrrrrrrrrrrrrrrrrrrrrrrrrrrrrrrrrrrrrrrrrrrrrrrrrrrrrrrrrrrrrrrrrrrrrrrrrrrrrrrrrrrrr

149 connections in 0.06s; 2668.91 connections/user sec, bytes read 0
149 connections in 30 real seconds, 0 bytes read per connection
cURL also uses the openssl client and thus the timing info you get with the time_appconnect is pretty accurate. Remember, once again this is one single metric measurement. To see the performance of your SSL Handshakes make sure you are measuring form different vantage points.
Also, a good test to do is to simply check the validit of your SSL certifiates on your servers periodically. The application architecture has become so complex today and span across several servers that its a common problem that an SSL certifciate wasn't updated on one of the servers causing intermitten SSL issues to an applicaiotn.
One of the best resources to test SSL is https://badssl.com. Simply run cURL to one of the many examples on their website to see what are the different array of issues an SSL certiciate can have. This will ensure your team is checking for these issues and when you encouter one of them you know exactly what the problem is. Its always good practice to show what kind of SSL error occured isntead of simply saying a "SSL exception occured".
The new HTTP/3 Protocol (BETA)
Earlier in this article I talked about how TCP guarantees reliability in regards to the stream but it does not guarantee that every send() was recv()’d. This means in a TCP oriented connection, my send() is going to wait until it gets a recv(). This is one of the biggest reasons voice and video communication uses UDP.
HTTP/3 replaces TCP protocol with Google’s QUIC protocol and it also uses TLS 1.3 by default for security. QUIC (Quick UDP Internet Connections) is designed to be faster with lower latency compared to TCP. It offers less overhead when establishing a connection and quirk data transfer over the connection. The biggest difference (in my opinion) is that unlike TCP, an error - like a resource that gets lost along the way won’t cause the connection to stop and wait until the problem is fixed. Instead, QUIC keeps transferring other data while it tries to figure out how to resolve the issue.
QUIC is already available on Google Chrome and Google uses it to communicate with its services. The adoption for QUIC is growing and will make its way to browsers and web servers.
At the moment only Safari browser does not seem to support QUIC protocol.
HTTP Request (time_pretransfer)
After all of this, we are now ready to send out the HTTP request tot he server. A HTTP request is a text string that’s generated by the client and sent to the server. This string of text contains the specifications of the resource (that can be accessed by the web) that the client is asking the server for. Apart from resources, the client will also mention how it wants to interact with and how the it wants to interact with the resource, along with metadata held in the headers.
Now having said that, there are multiple different kind of HTTP requests and the most common methods are GET, POST, PUT & DELETE. These typically align well with your CRUD operations that you would perform with an interactive application.
HTTP Response (time_starttransfer)
The server seems an HTPP response to the client in response to a HTTP request. The respond typically contains a status code and in case of a successful response the requested resources. In our output above notice the first line:
HTTP/2 200
Here the status code is 200 which simply means OK or in other words it was a successful transaction. Mozilla has maintained a detailed list of all HTTP status code if you like to give it a look.
This (popularly) is also called the Time to First Byte (TTFB). TTFB indicates the amount of time it takes before the browser receives the very first byte of the page content. The longer it takes to get that data from the server, the longer it takes to display your web page. A lot of us also use this metric to identify if the server that is supposed to serve the content to the browser is having issues or not. It is recommended that your TTFB is less than 200 milliseconds.
What hapens when the response hits the Browser?
Now we ran a cURL command above and excluded almost everything except for the response headers. However, as you expected rendering a response is not straightforwad either.
A web page comprises of several resoruces including HTML, JavaScript, CSS, images, etc. And then for each of these resroucs there are several engiens that has a specific job before it renders the final page on the browser.

Explaining each of these compoents is definitely out of scope and not my cup of tea at the moment. However, there are tools like Google Puppeteer that you can use to get Browser specific metric. I have written about User Experience Metrics for Product Managers and I will continue to write about Browser timing metrics going forward.
Lets put this all together.
