Graphic Recording for Documentation
So to solve that issue, what I did was come up with a story line - one liners (and explanation when I had to explain a concept) with bit sized graphics.

As a Product Designer, wireframes, sketches act as a medium where I can think, explore, validate on a problem space. Be it a wire framing tool or just paper and pen, it works and I'm almost certain a lot of designers do. But the trouble is not there. That's a great approach; however the problem lies when it comes to documenting this. In the last few years, the amount of documentation that I find for existing products or my own design is almost nil. I see wireframes; big fat wireframes. The bigger the system, the more.
I don't see a summary, or a workflow of the problem that someone is trying to solve. Wireframe is not a great tool to deliver that message; forget about a workflow.
According to Will Evans
A picture is worth a thousand words; an interface is worth a thousand pictures; a theory is worth a thousand interfaces.
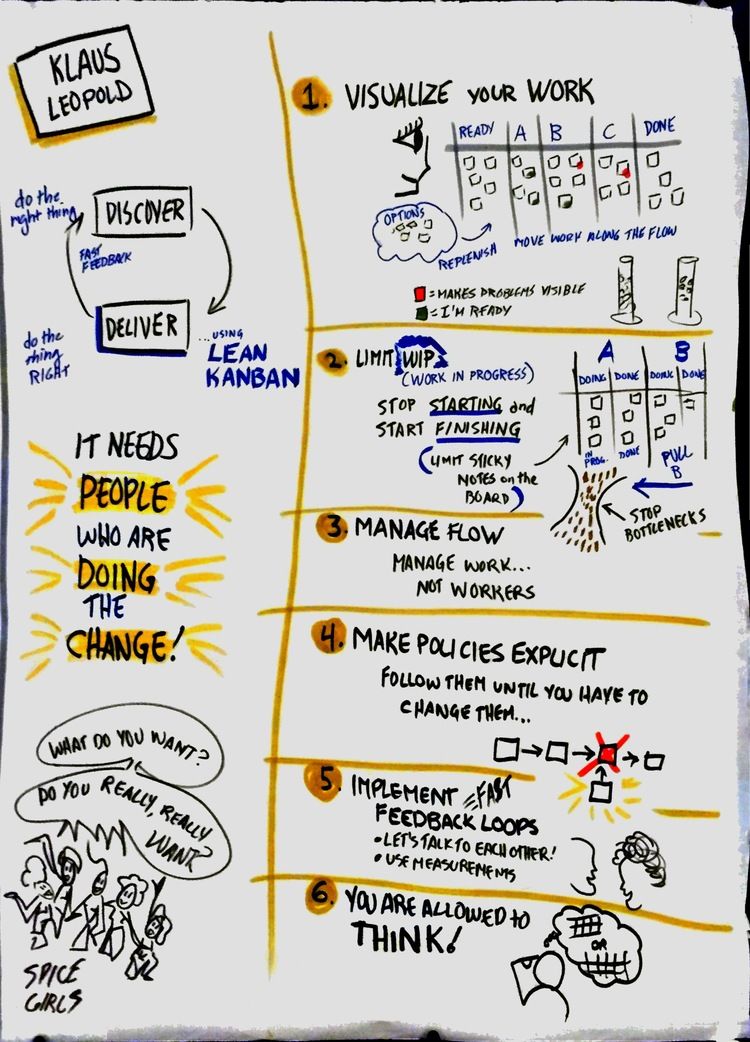
Earlier this month I got to attend LeanUX conference in Brooklyn. One of the best things at the conference was the Graphics Recording by Dean Meyers (@deanmeistr). His job although very creative was extremely important - record all the talks in a graphical way. Brilliant. I did not have to take down notes. All I had to do was once the talk was over and during a break walk over to the wall and snap a picture.
I came back to work with a solution to my cumbersome documenting issues. I quickly scribbled down workflows and summarized them in a graphical way. It was awesome. It was one of the best way to communicate the idea as to what exactly I'm trying to solve. I shared it with my team, bingo they got it right away.
I shared it with someone else with no context to my project to bring them on board; they came back with 100 questions.
What went wrong? I thought I had nailed it. I thought it was simple and intuitive. Everyone understand the diagrams I came up with. I shared the LeanUX conference graphic recordings with my colleagues, and I realized, that a narration was also important. It was easier for me and my team to understand these diagrams because we have a great context around it.
So to solve that issue, what I did was come up with a story line - one liners (and explanation when I had to explain a concept) with bit sized graphics. This was perfect it explained the workflow bit by bit and then zoomed out to show the big picture. Something like what Prezi does and thats exactly what I did.
If you have the patience to draw and scan, Prezi has been an excellent tool.